

RTÉ is Ireland’s Public Service Media Organisation and I work as Product Design Lead on the Design and UX team. This case study aims to share my process designing a system for RTÉ News’ online live election coverage on rte.ie – from constituency and candidate profiles in the run up to Election day to live voting results after the polls close.
Getting Started
RTÉ General Election Coverage
RTÉ’s general election coverage is always a varied and complex logistical project, with one of its largest studios turned into an election results centre which receives live updates from every count centre in the country. RTÉ broadcasts live, all-day TV coverage and analysis of election results from the results centre with reports from around the country. The election is also heavily covered on RTÉ radio.
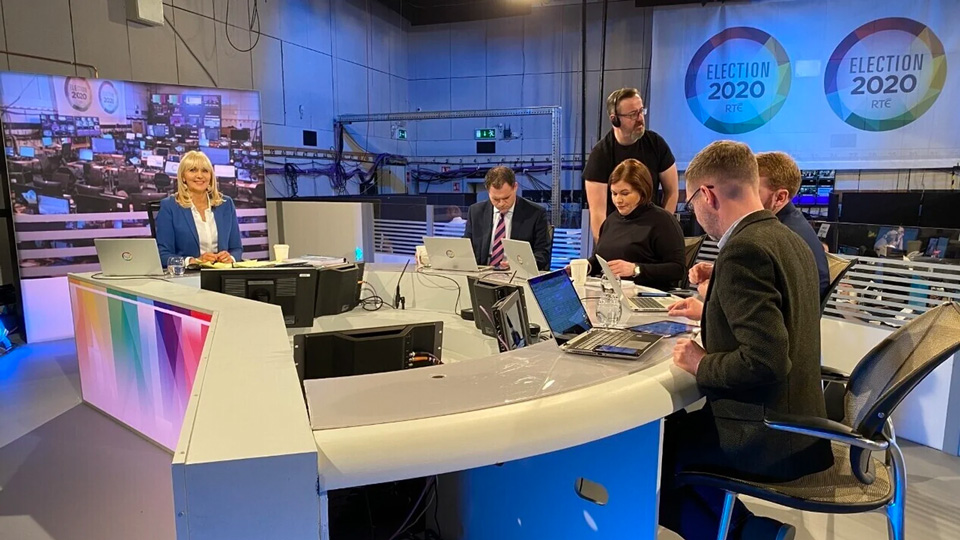
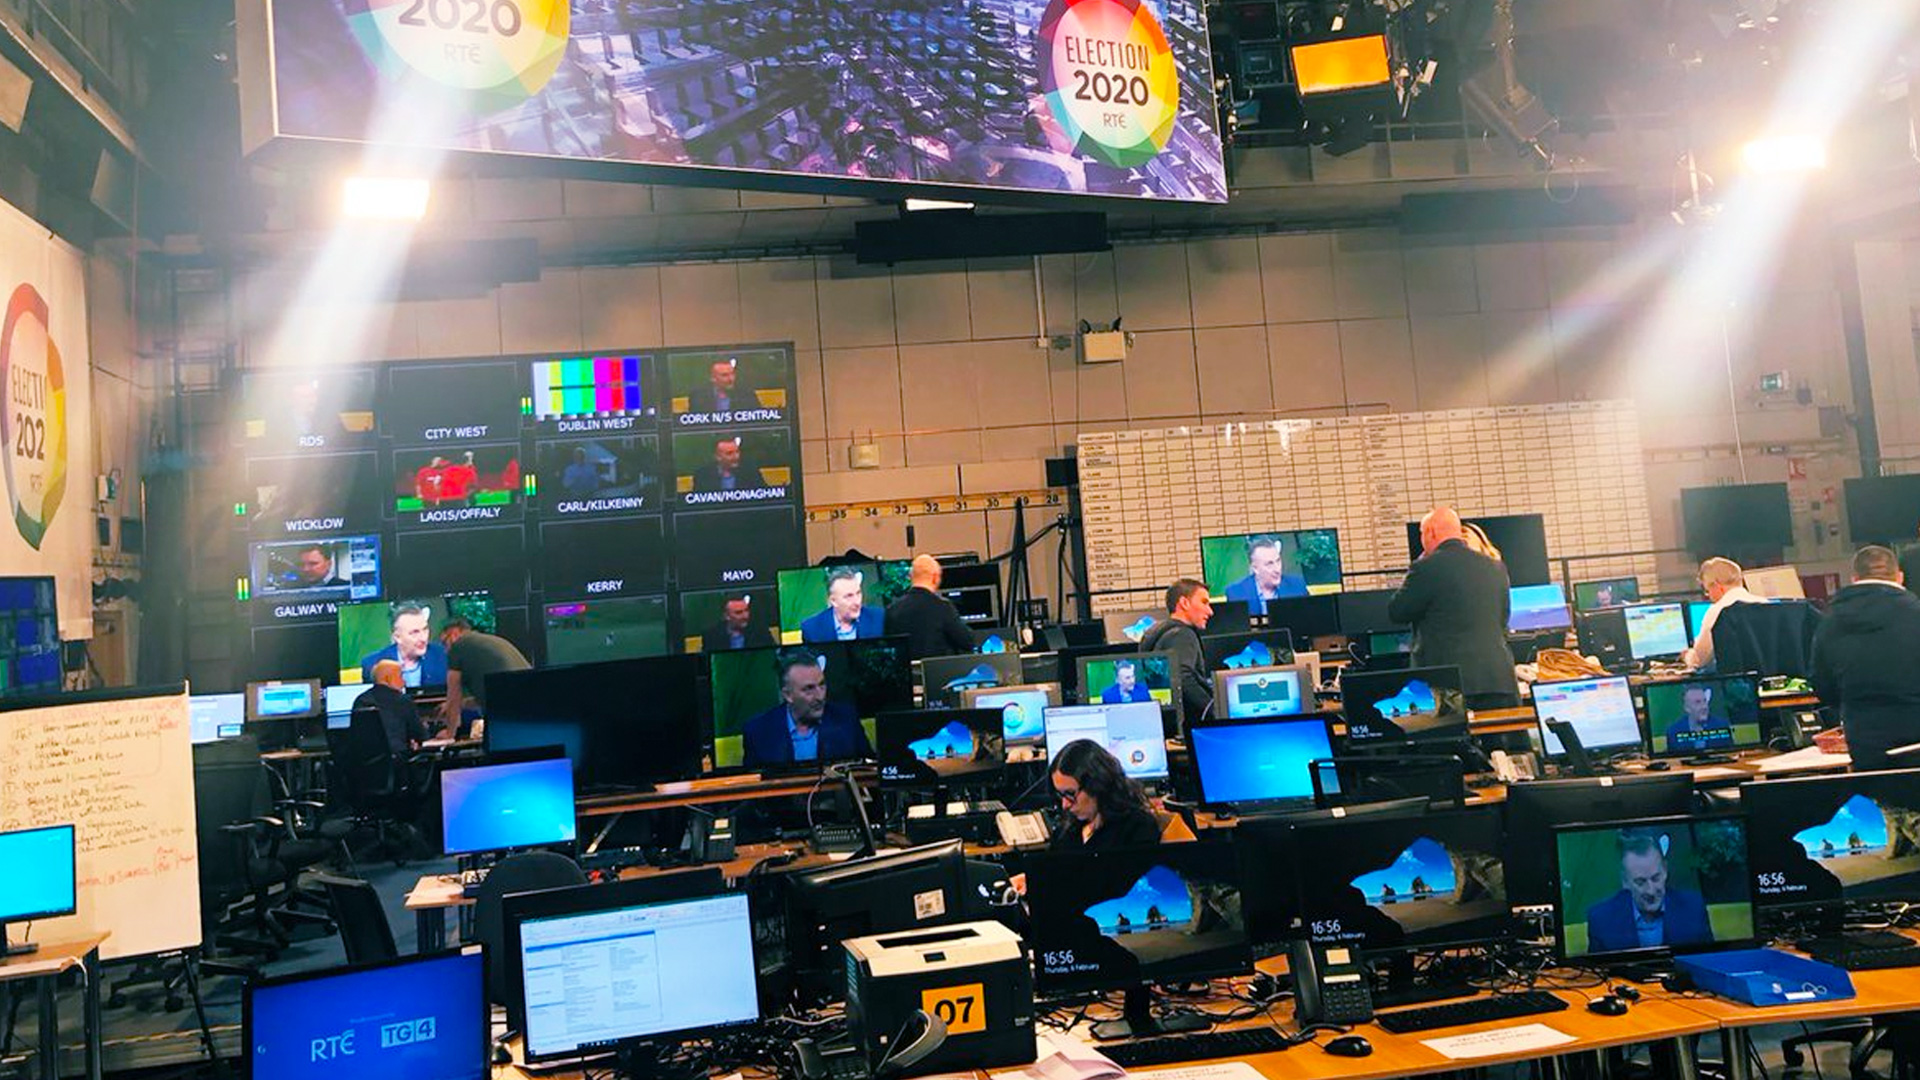
The live election results on rte.ie are powered by the data gathered and checked by staff in the results centre.
How Irish Elections Work
My first project when I started in RTÉ in 2016 was the General Election website (which was shortlisted for a Spider award that year). At the time, I didn’t understand fully how the Irish electoral system, proportional representation, worked. Below is a quick explanation of how it works.
- Voters write numbers next to candidates on the ballot paper in order of preference.
- Each constituency has a quota and number of government seats based on the size of the electorate.
- First preference votes are counted and candidates who reach the quota are elected.
- Once a candidate reaches the quota of votes required to secure a seat in their constituency, any surplus in votes for that candidate is then redistributed to the second preference candidate on the remaining ballot papers and so on.
- Poorly performing candidates are also excluded in each count and their votes are transferred to the second, third etc. preference candidates on those ballot papers.
- Once all the seats in all constituencies are filled, the party with the most first preference votes must form a government (with an 80-seat majority) with other parties as soon as possible.
An Election Design System
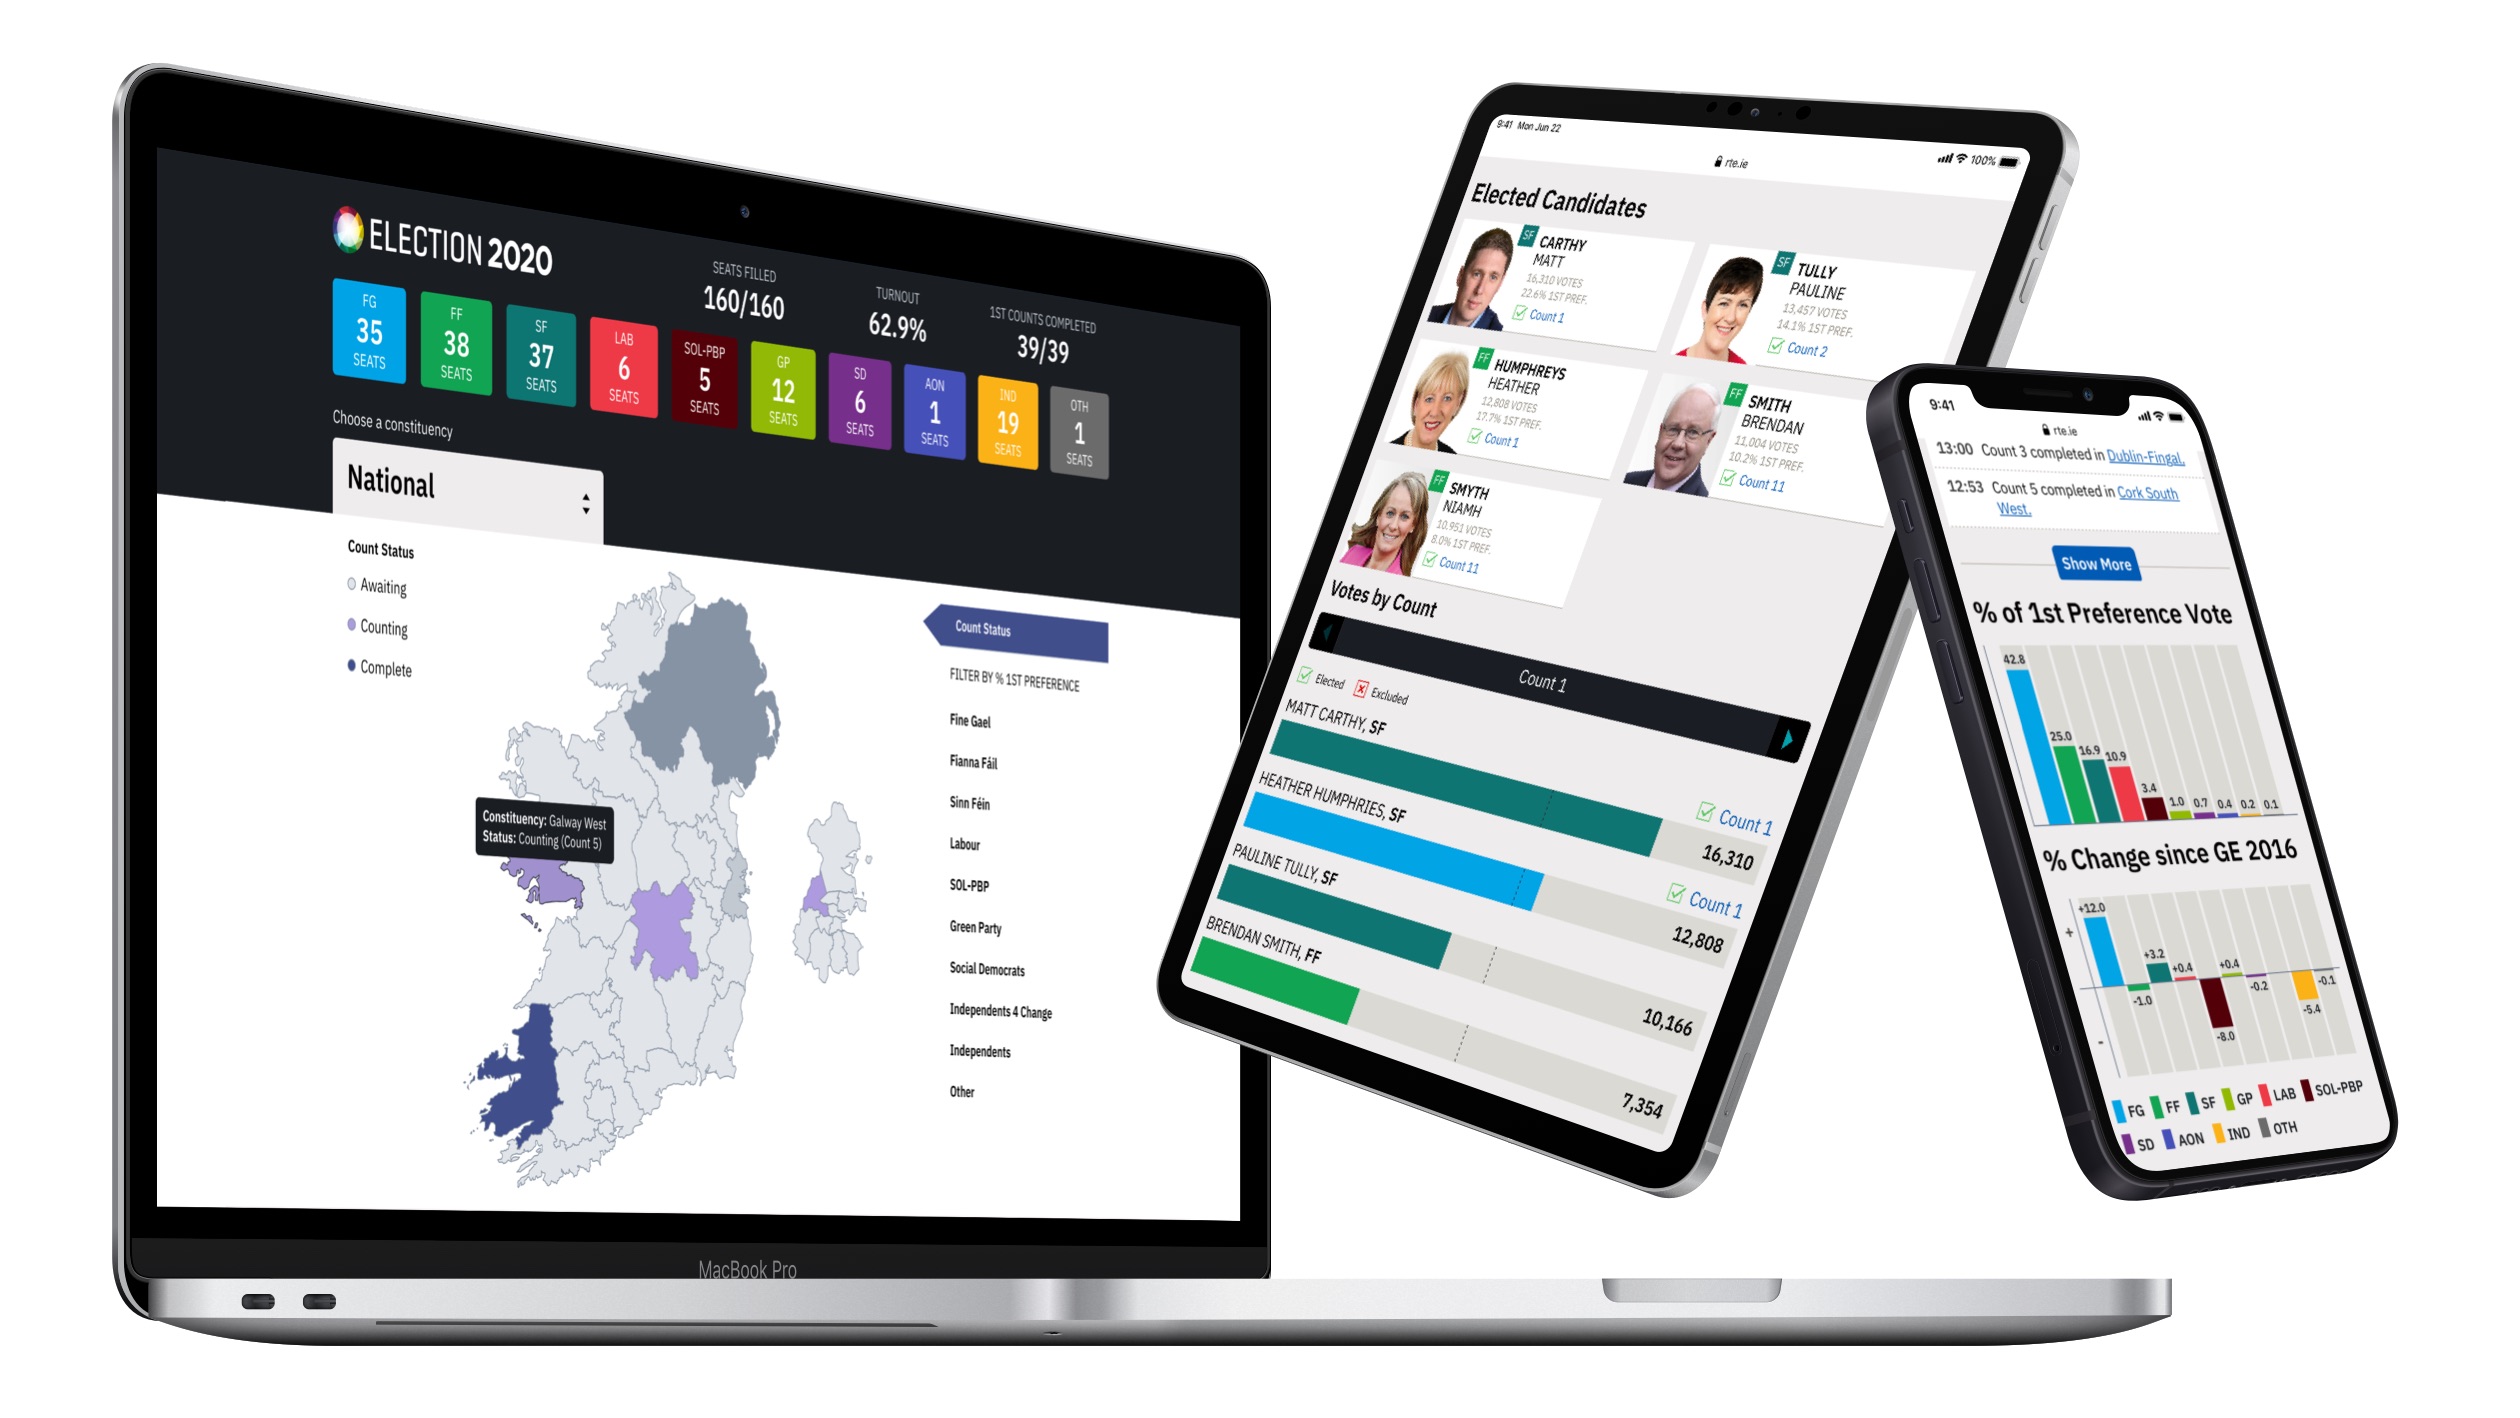
The main goal of the online election results is to try to present the key elements of the electoral system: party seats won, candidate votes, elected candidates and party first preference as clearly as possible for mobile, tablet and desktop users on a national and constituency level.
Since 2016, through two General Elections, Local and European Elections, By-Elections, Northern Ireland Assembly Elections and a Presidential Election, I have developed and iterated a simple design system of page templates, panels and components that connect to allow users to view all available election results and information.
Note: The examples below show the election design system as updated to match the new rte.ie visual language. The data shown on the designs is not always a fully accurate representation of real past election data, but used to show how the various panels work.
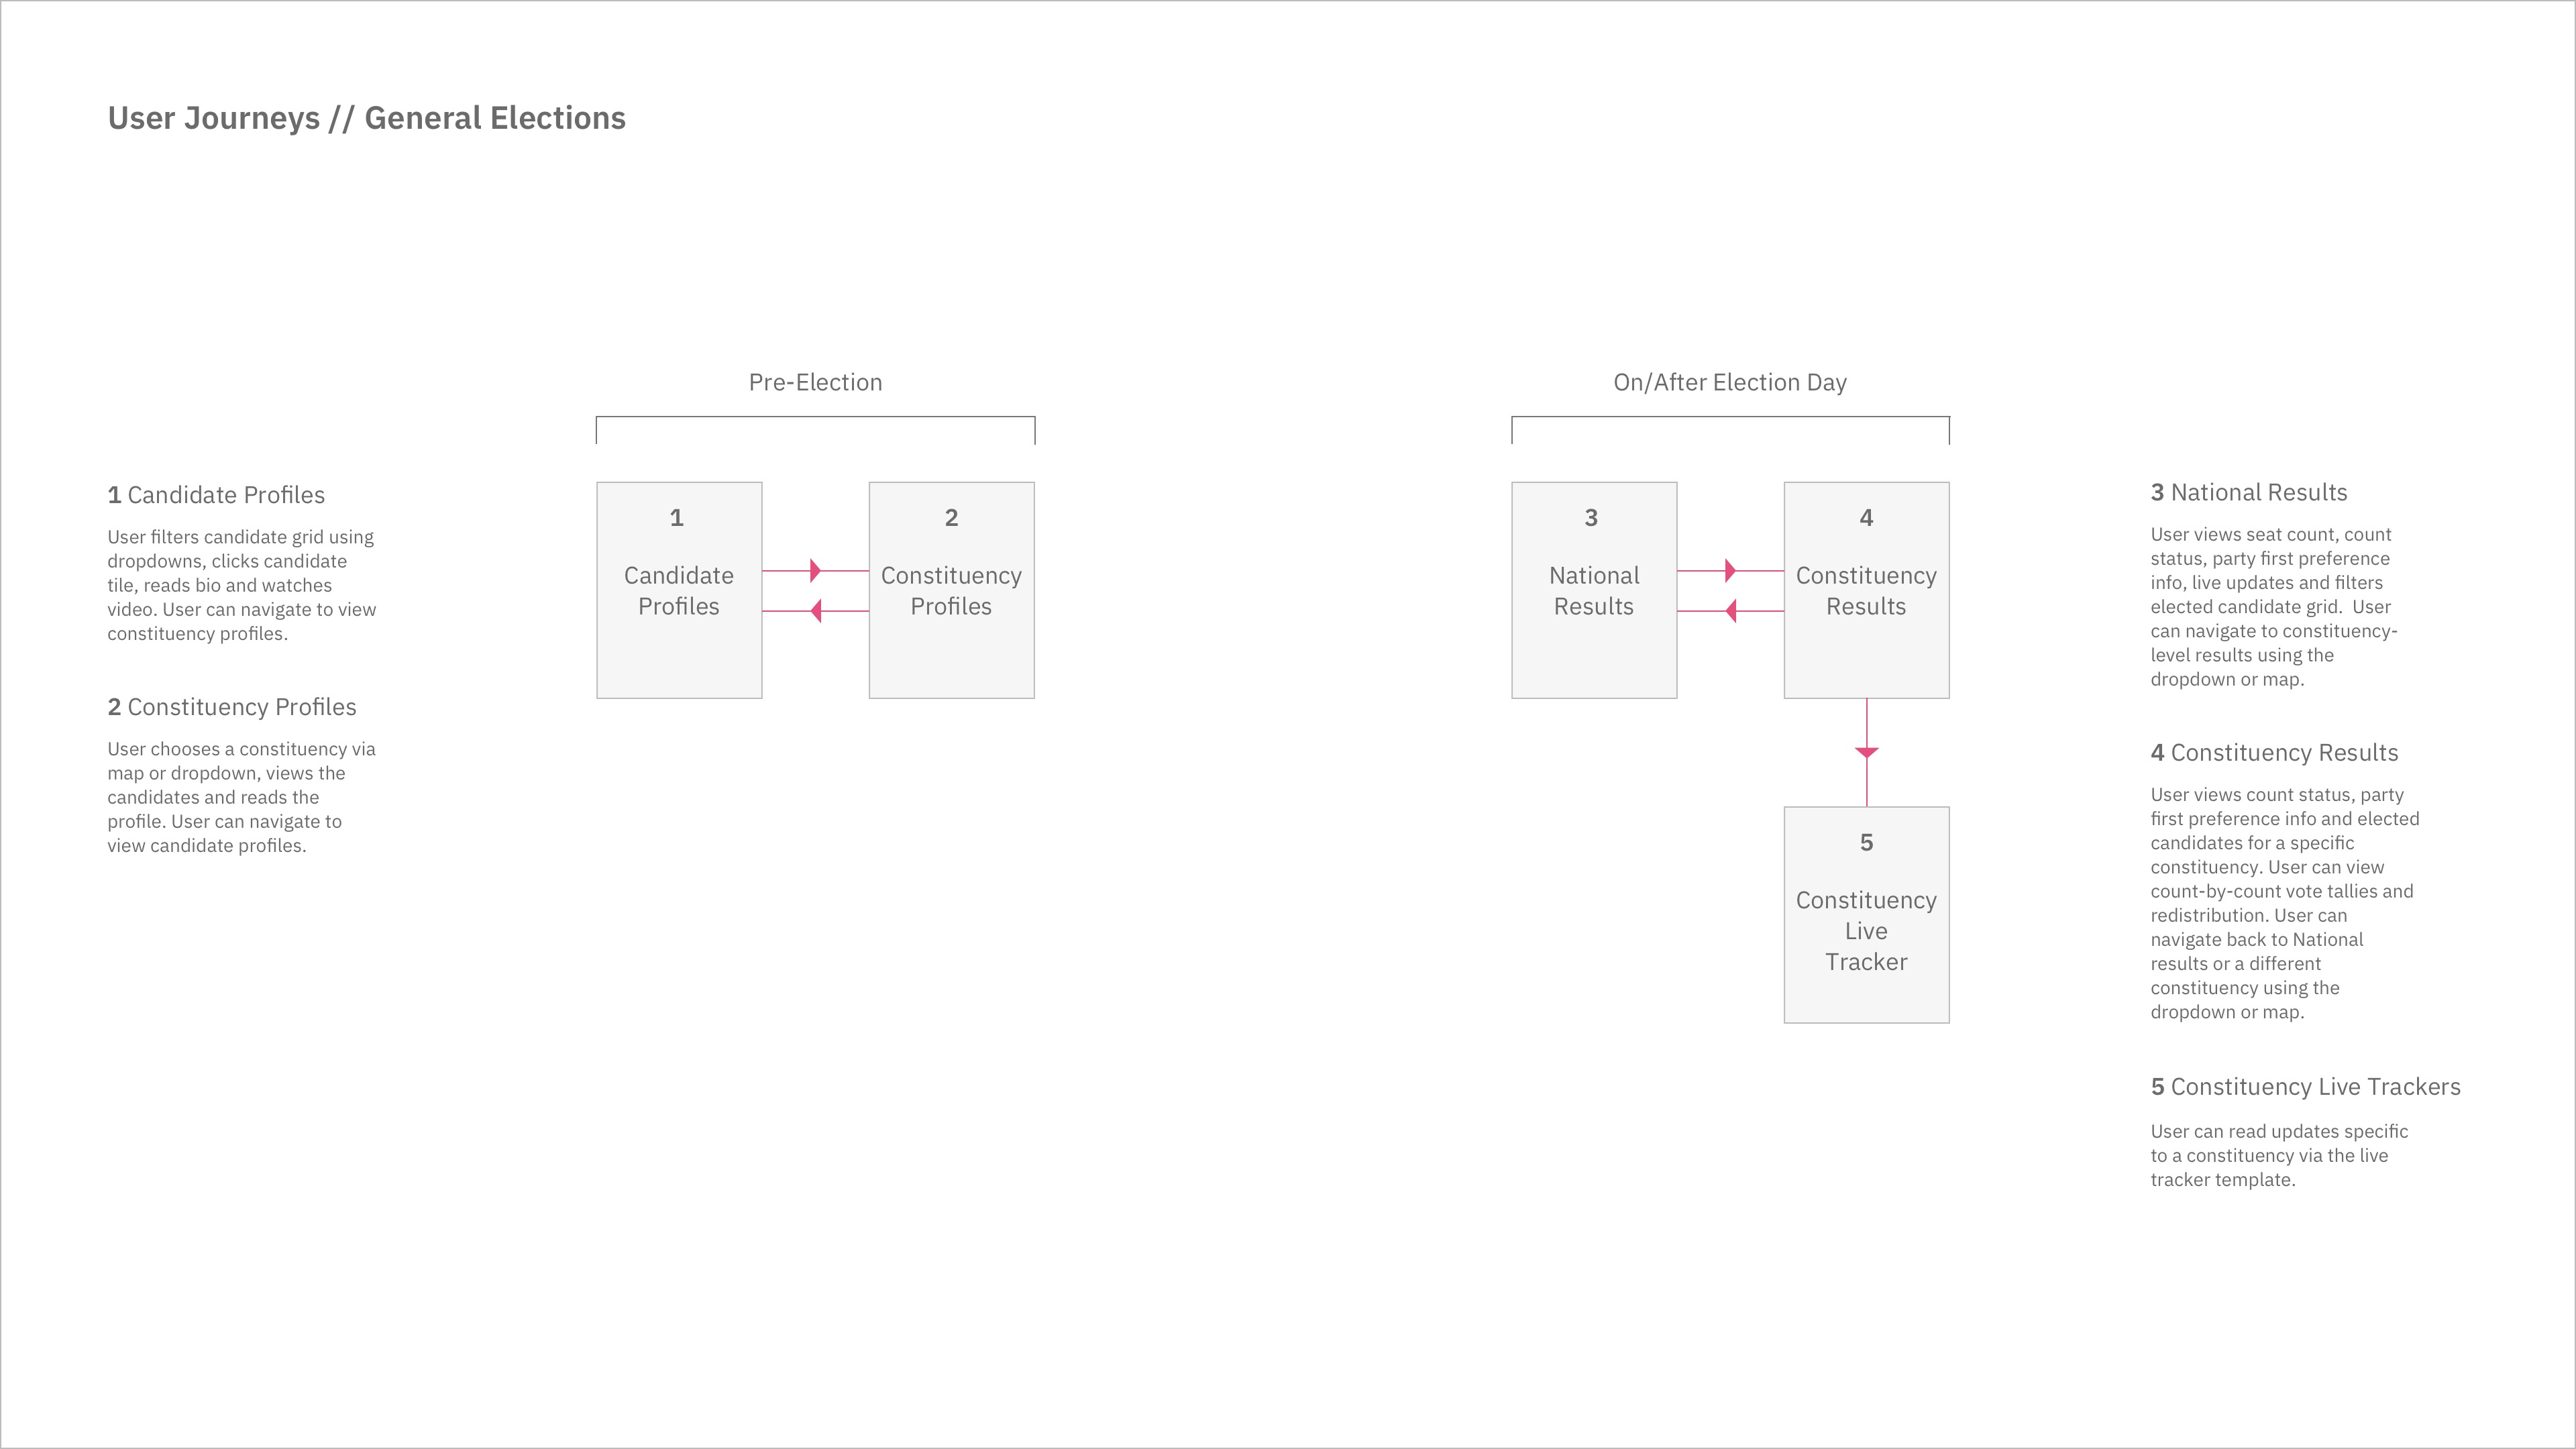
User journeys for the online election page templates before and after election day.
Foundations and Components
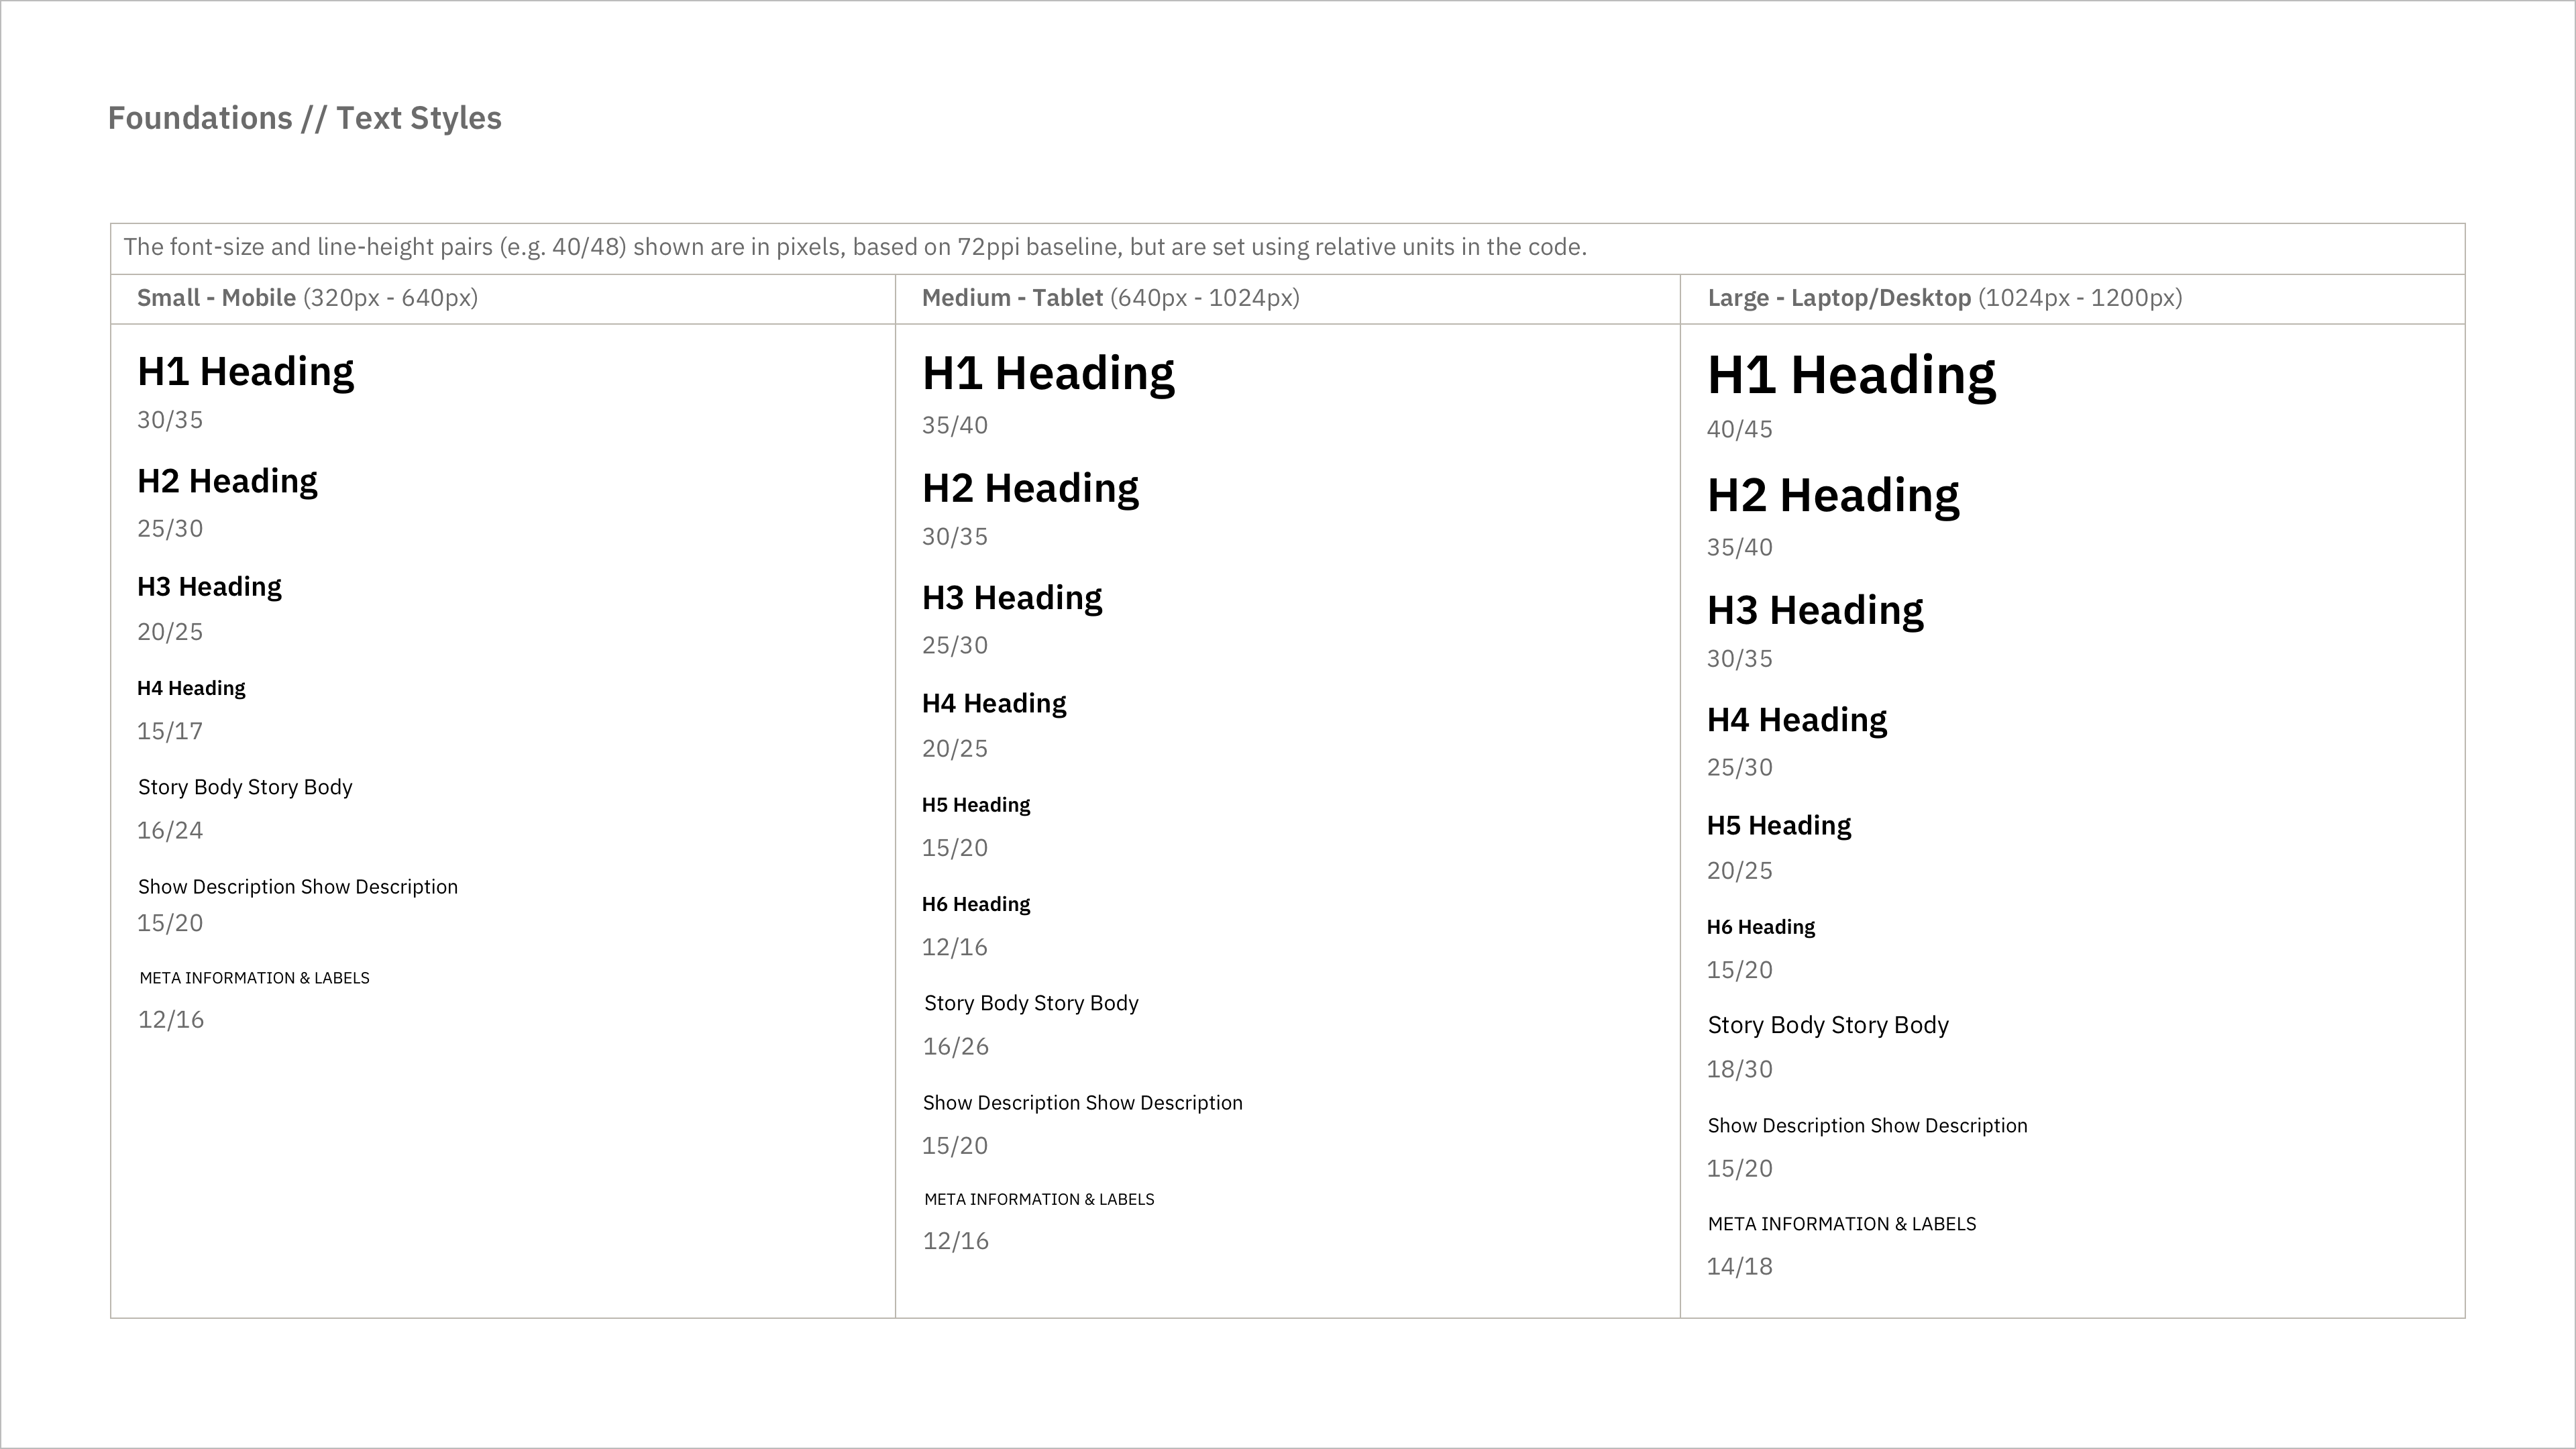
The foundations (grid, spacing, text styles, icons and palette) and components (buttons, text inputs) of the election design system are based on the rte.ie design system.
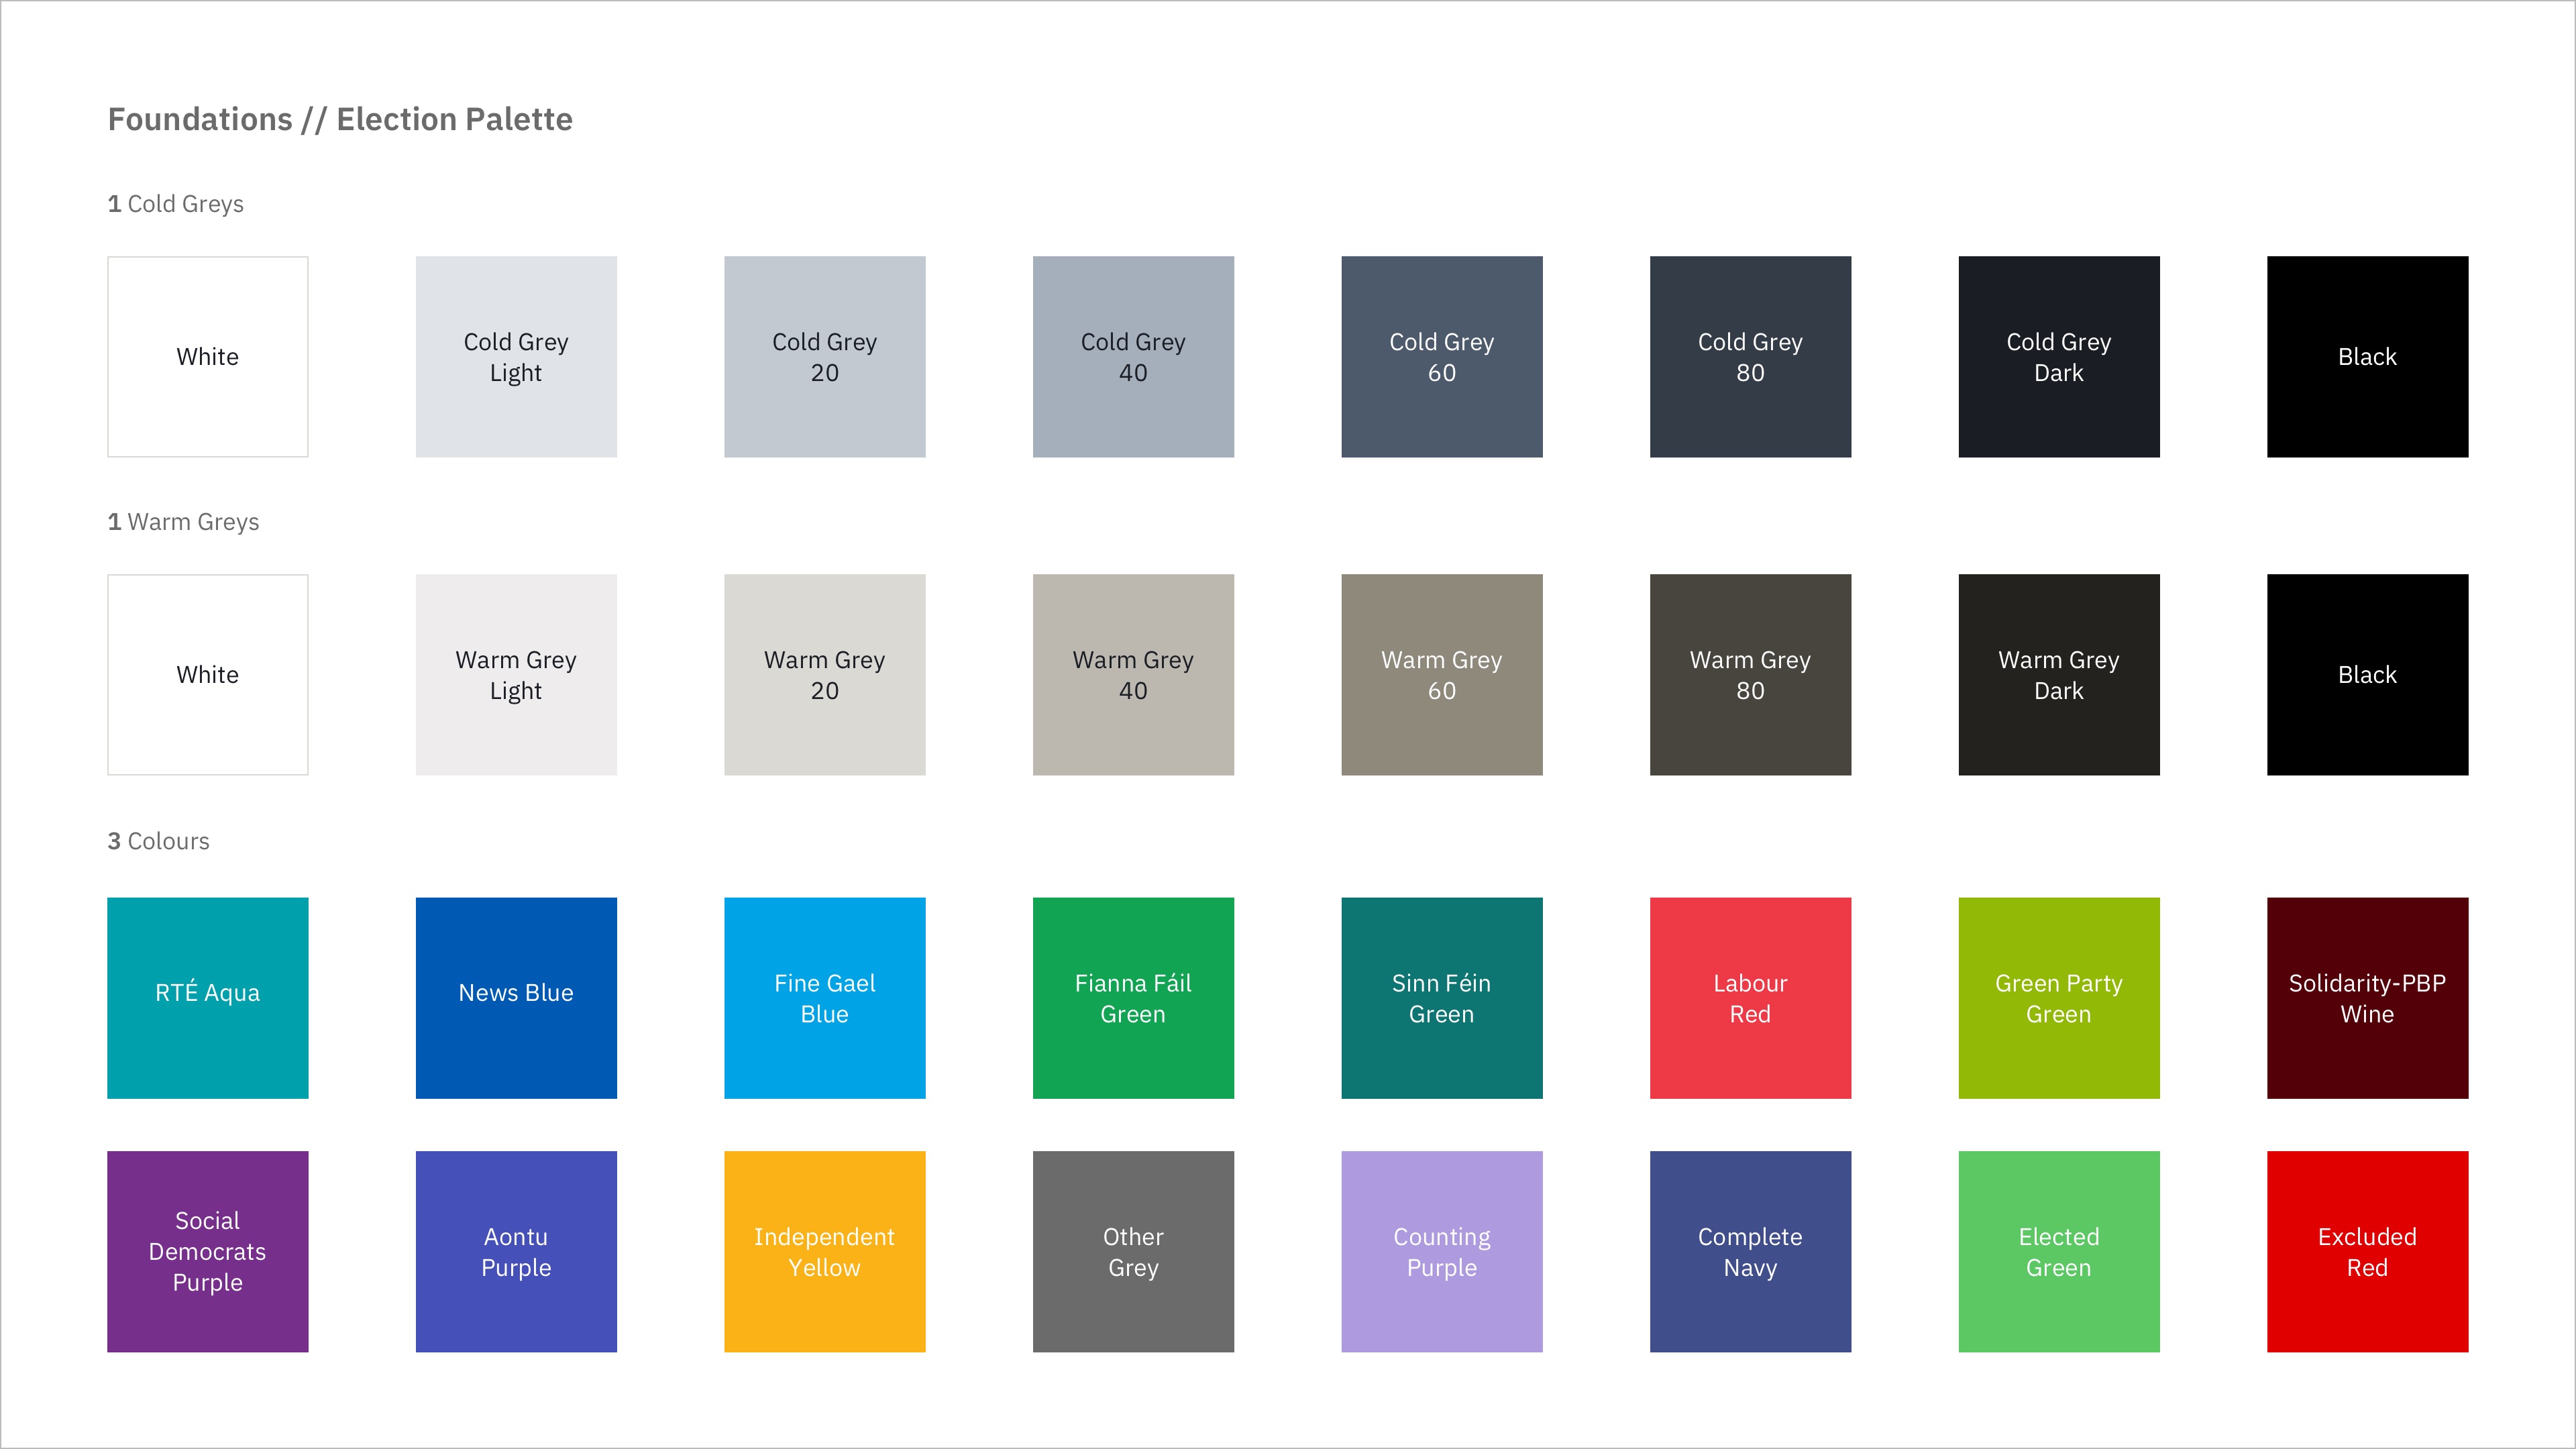
The palette includes greyscale colours as well as the main party colours used by the RTÉ TV Graphics department for their live election coverage to keep the colours recognisable and consistent across platforms. The party colours are used to highlight the party affiliation on all panels.
Panels
The election design system includes responsive candidate and constituency profiles, national and constituency results page templates and a variation of the rte.ie live tracker template for live updates.
Each page template is made up of panels – reusable patterns that can be stacked in different orders to build the required page.
Below, I’ll go through each panel in the election design system, explain how they work and show how the overall page templates work when the panels are combined.
Seat Counter Panel
The Seat Counter panel acts as the page header and shows the user at a glance how many seats each party has won, along with other important information. This panel can be added by editors to the rte.ie home page or News index page and clicking anywhere on the panel takes the user to the live national results view.
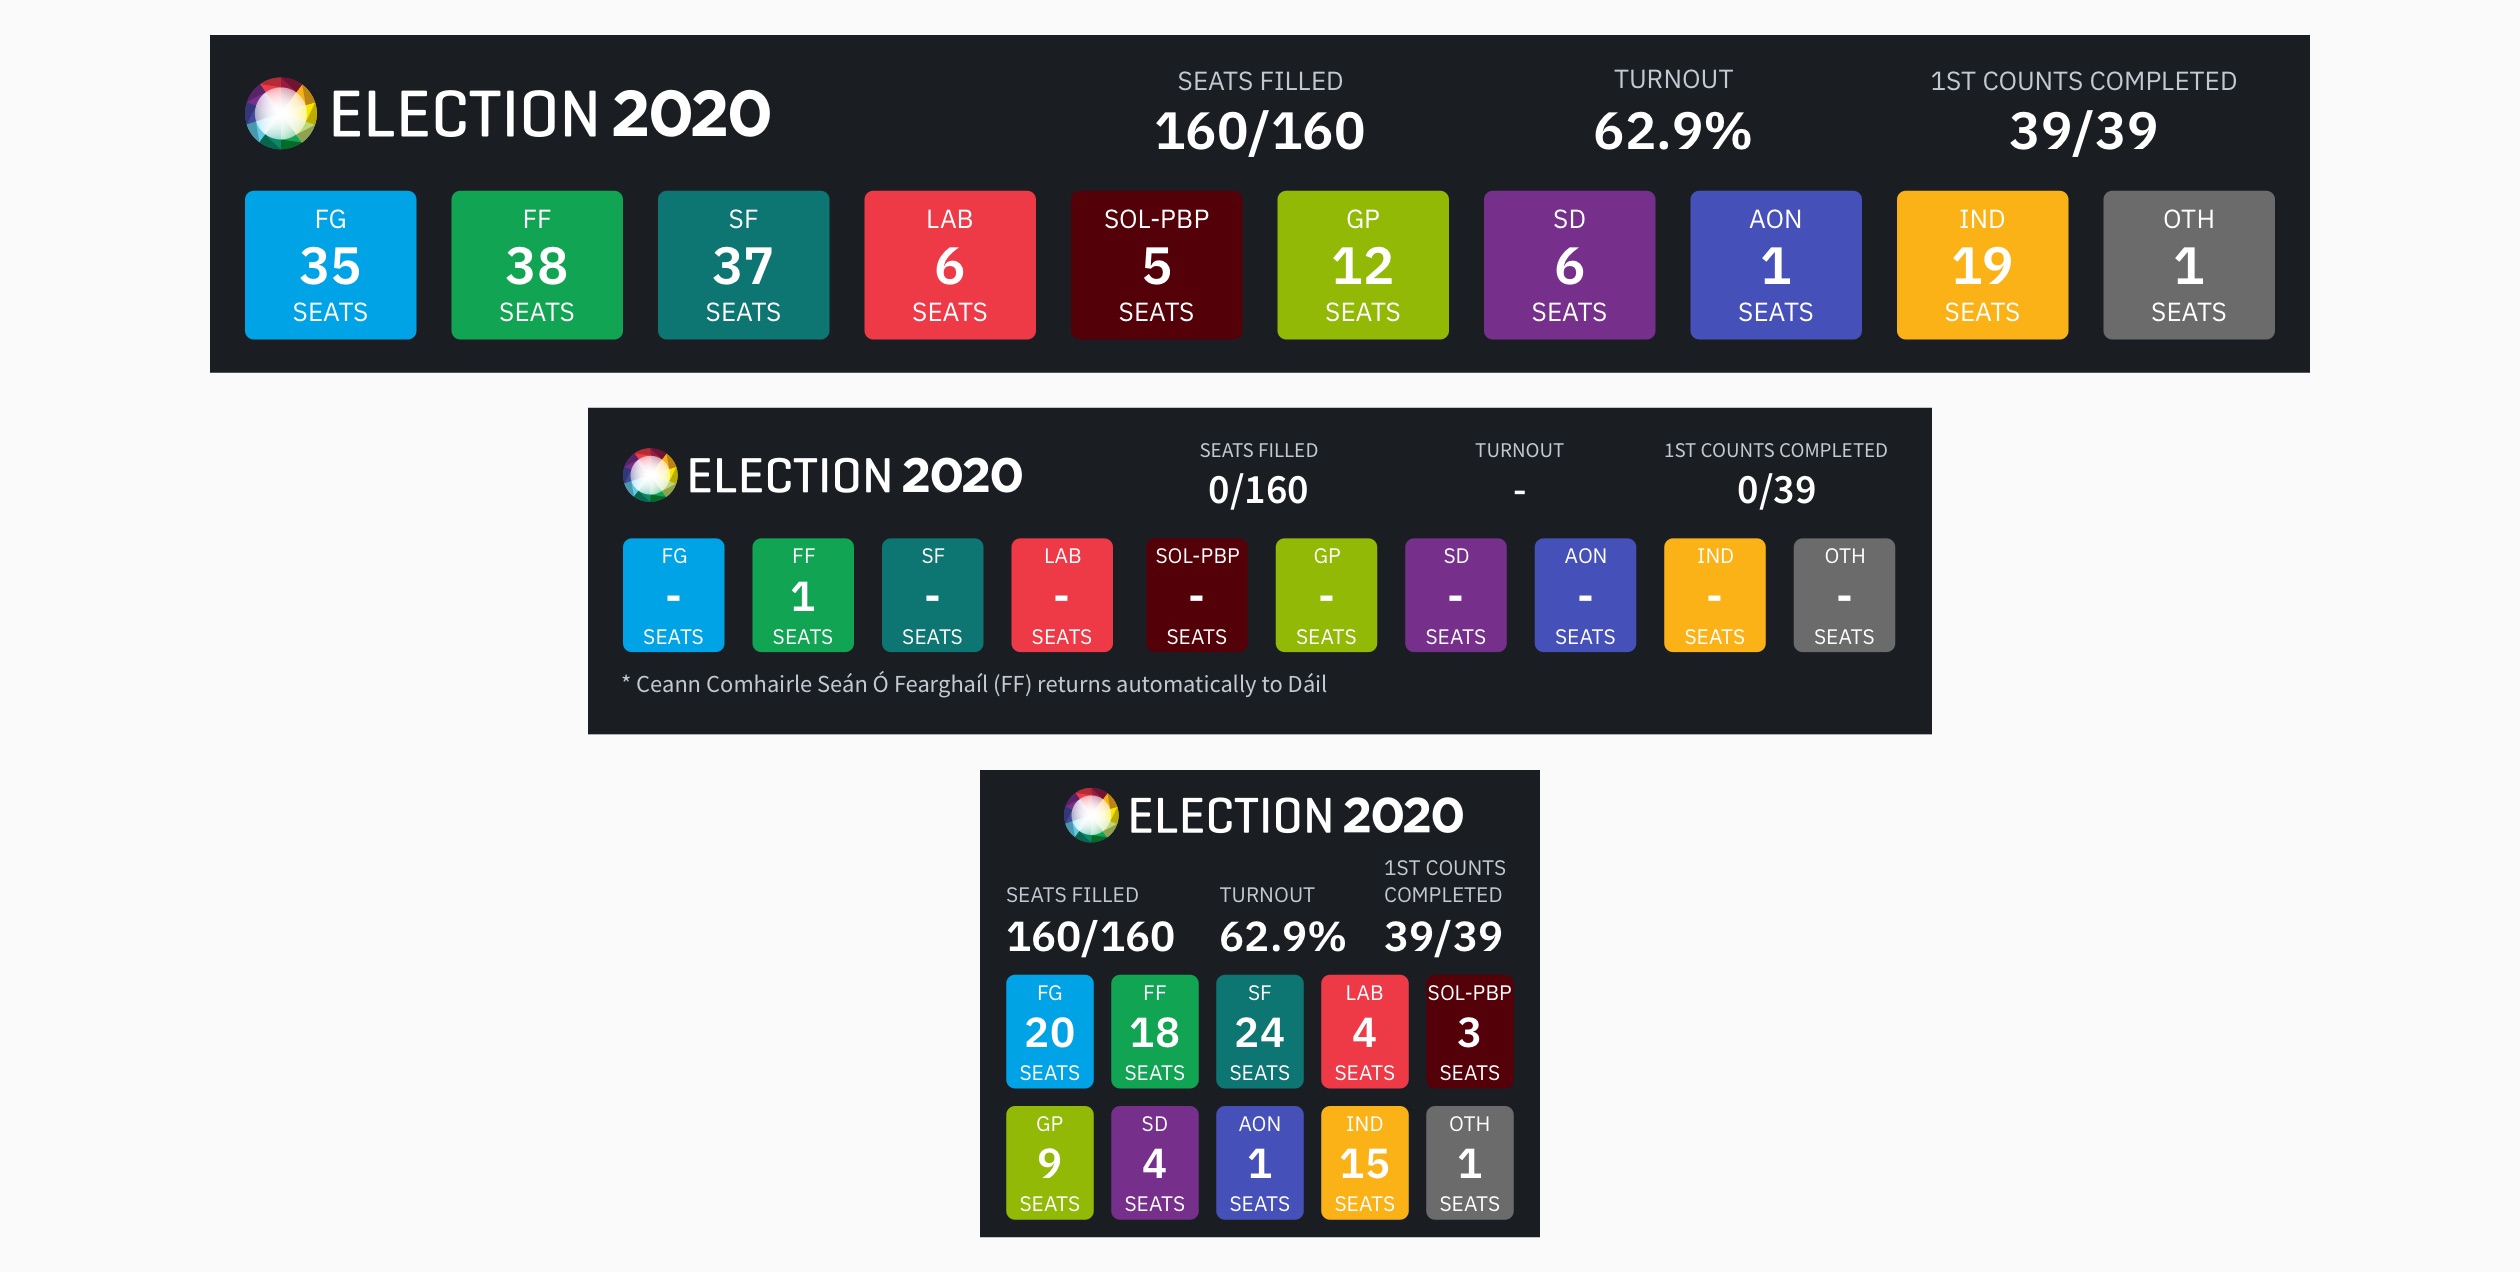
Responsive designs for the seat counter panel.
Constituency Dropdown Panel
The Constituency Dropdown panel allows users to quickly select and visit their preferred constituency page.
Constituency dropdown states.
Constituency Map Panel
The Constituency Map panel allows users to see the current count status in all national constituencies at a glance. Tooltips are displayed on hover for desktop users.
National map showing various constituency count states.
They can also click a party name to see how many first preference votes the party received per constituency using a party colour heat-map. This gives a good idea of which areas of the country had greater support for a party.
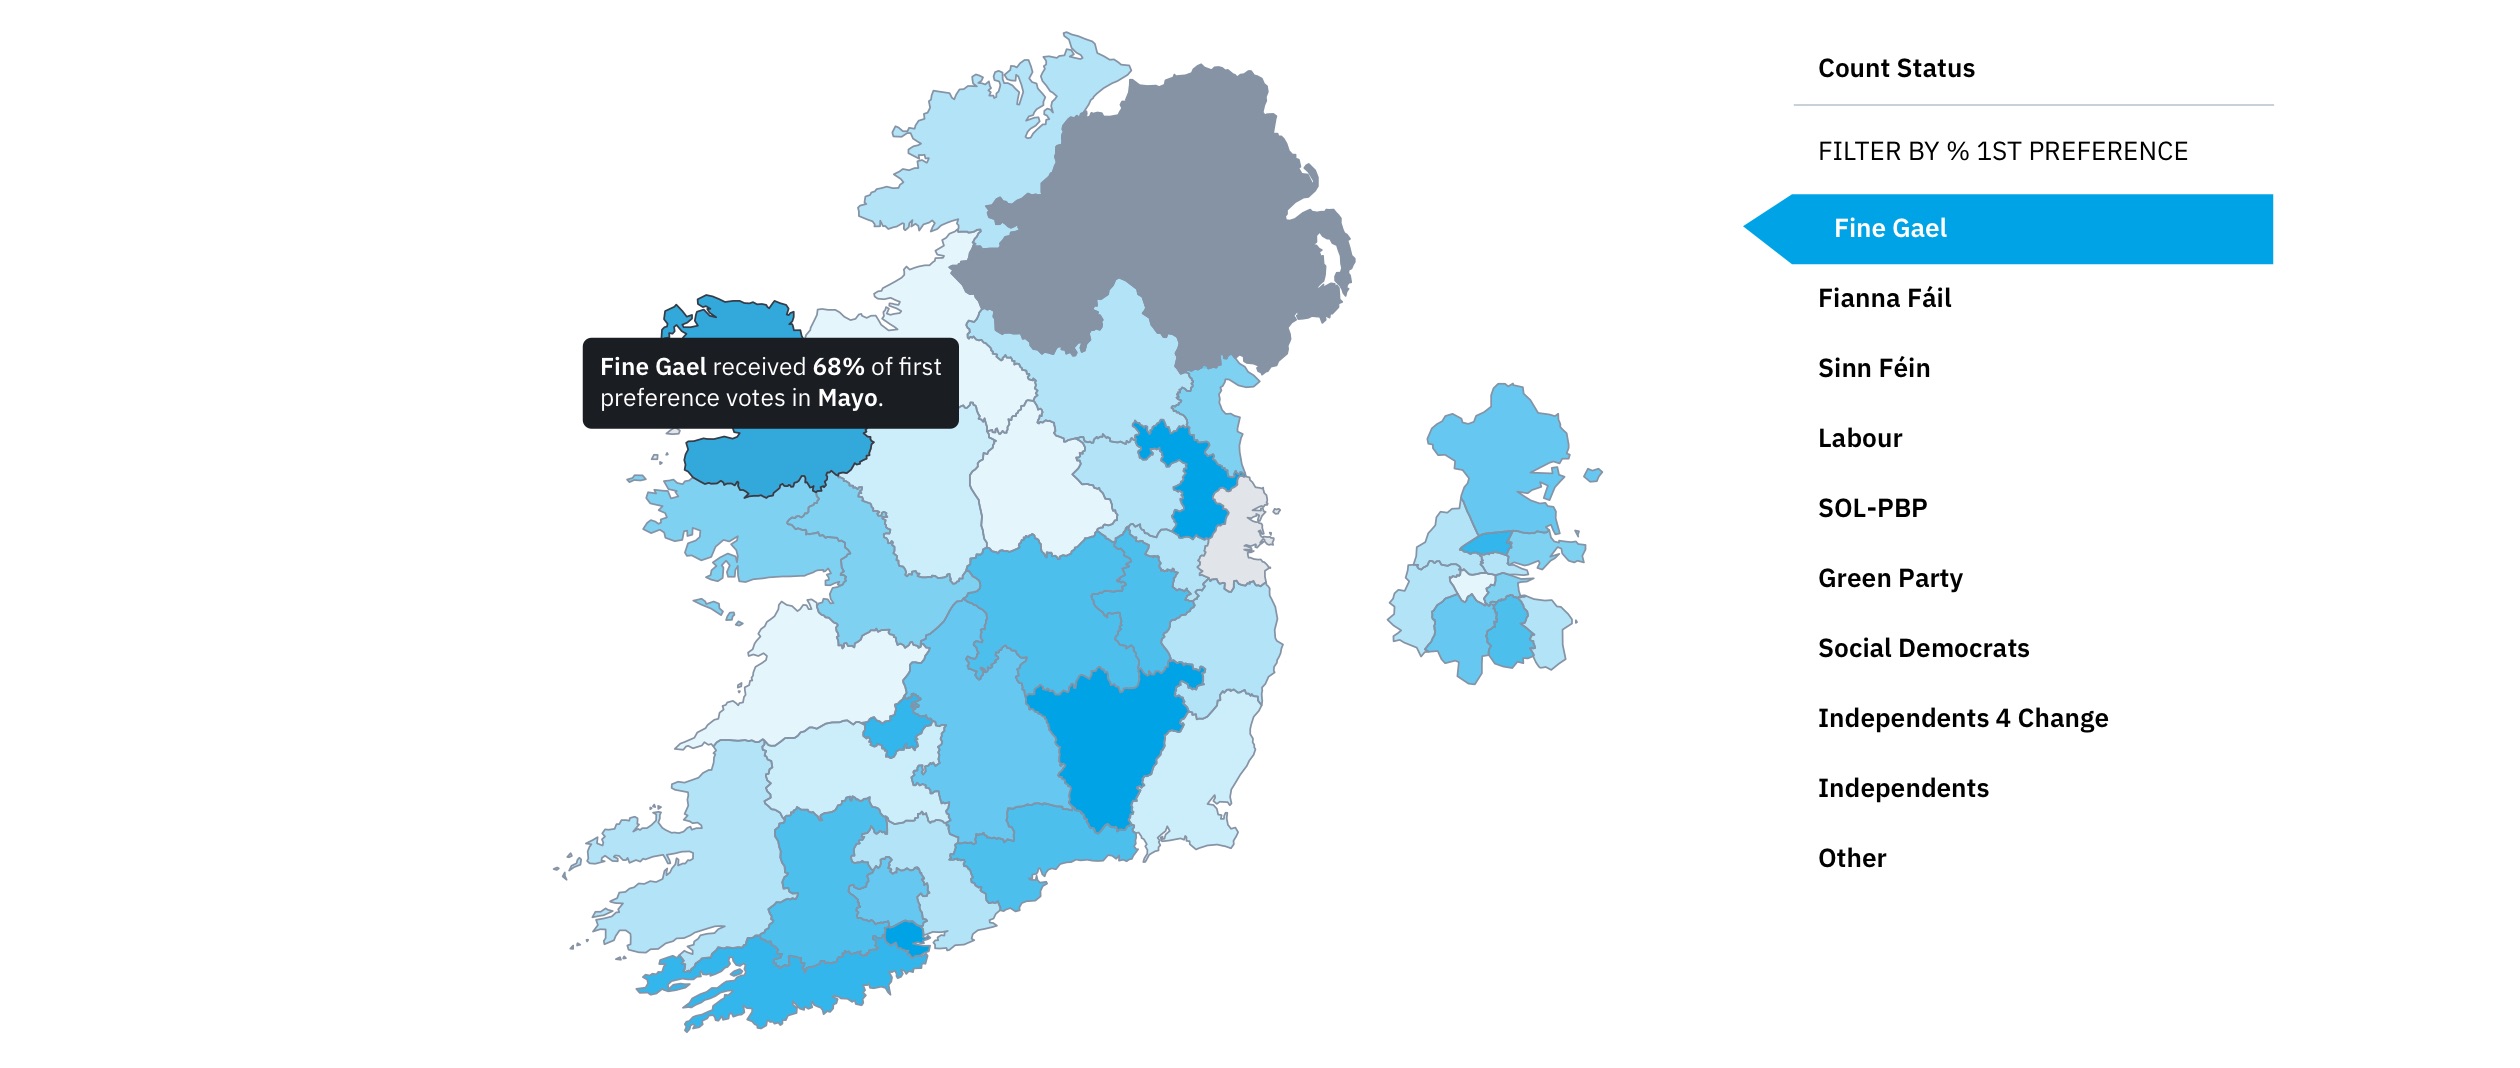
Constituency map showing first party preference heat-map.
Clicking on a constituency on the map zooms in to that constituency and displays the count status and other constituency-specific information next to it.
Constituency map zoomed to a constituency.
Party First Preference Panel
The Party First Preference panel allows users to quickly see in a bar chart how many first preference votes each party received. Doughnut charts were used originally but small parties having a very small percentage share caused legibility issues so we swapped to using bar charts. Users can also view the swing in party vote share since the last General Election. Informative tooltips are displayed over chart bars on hover/tap.
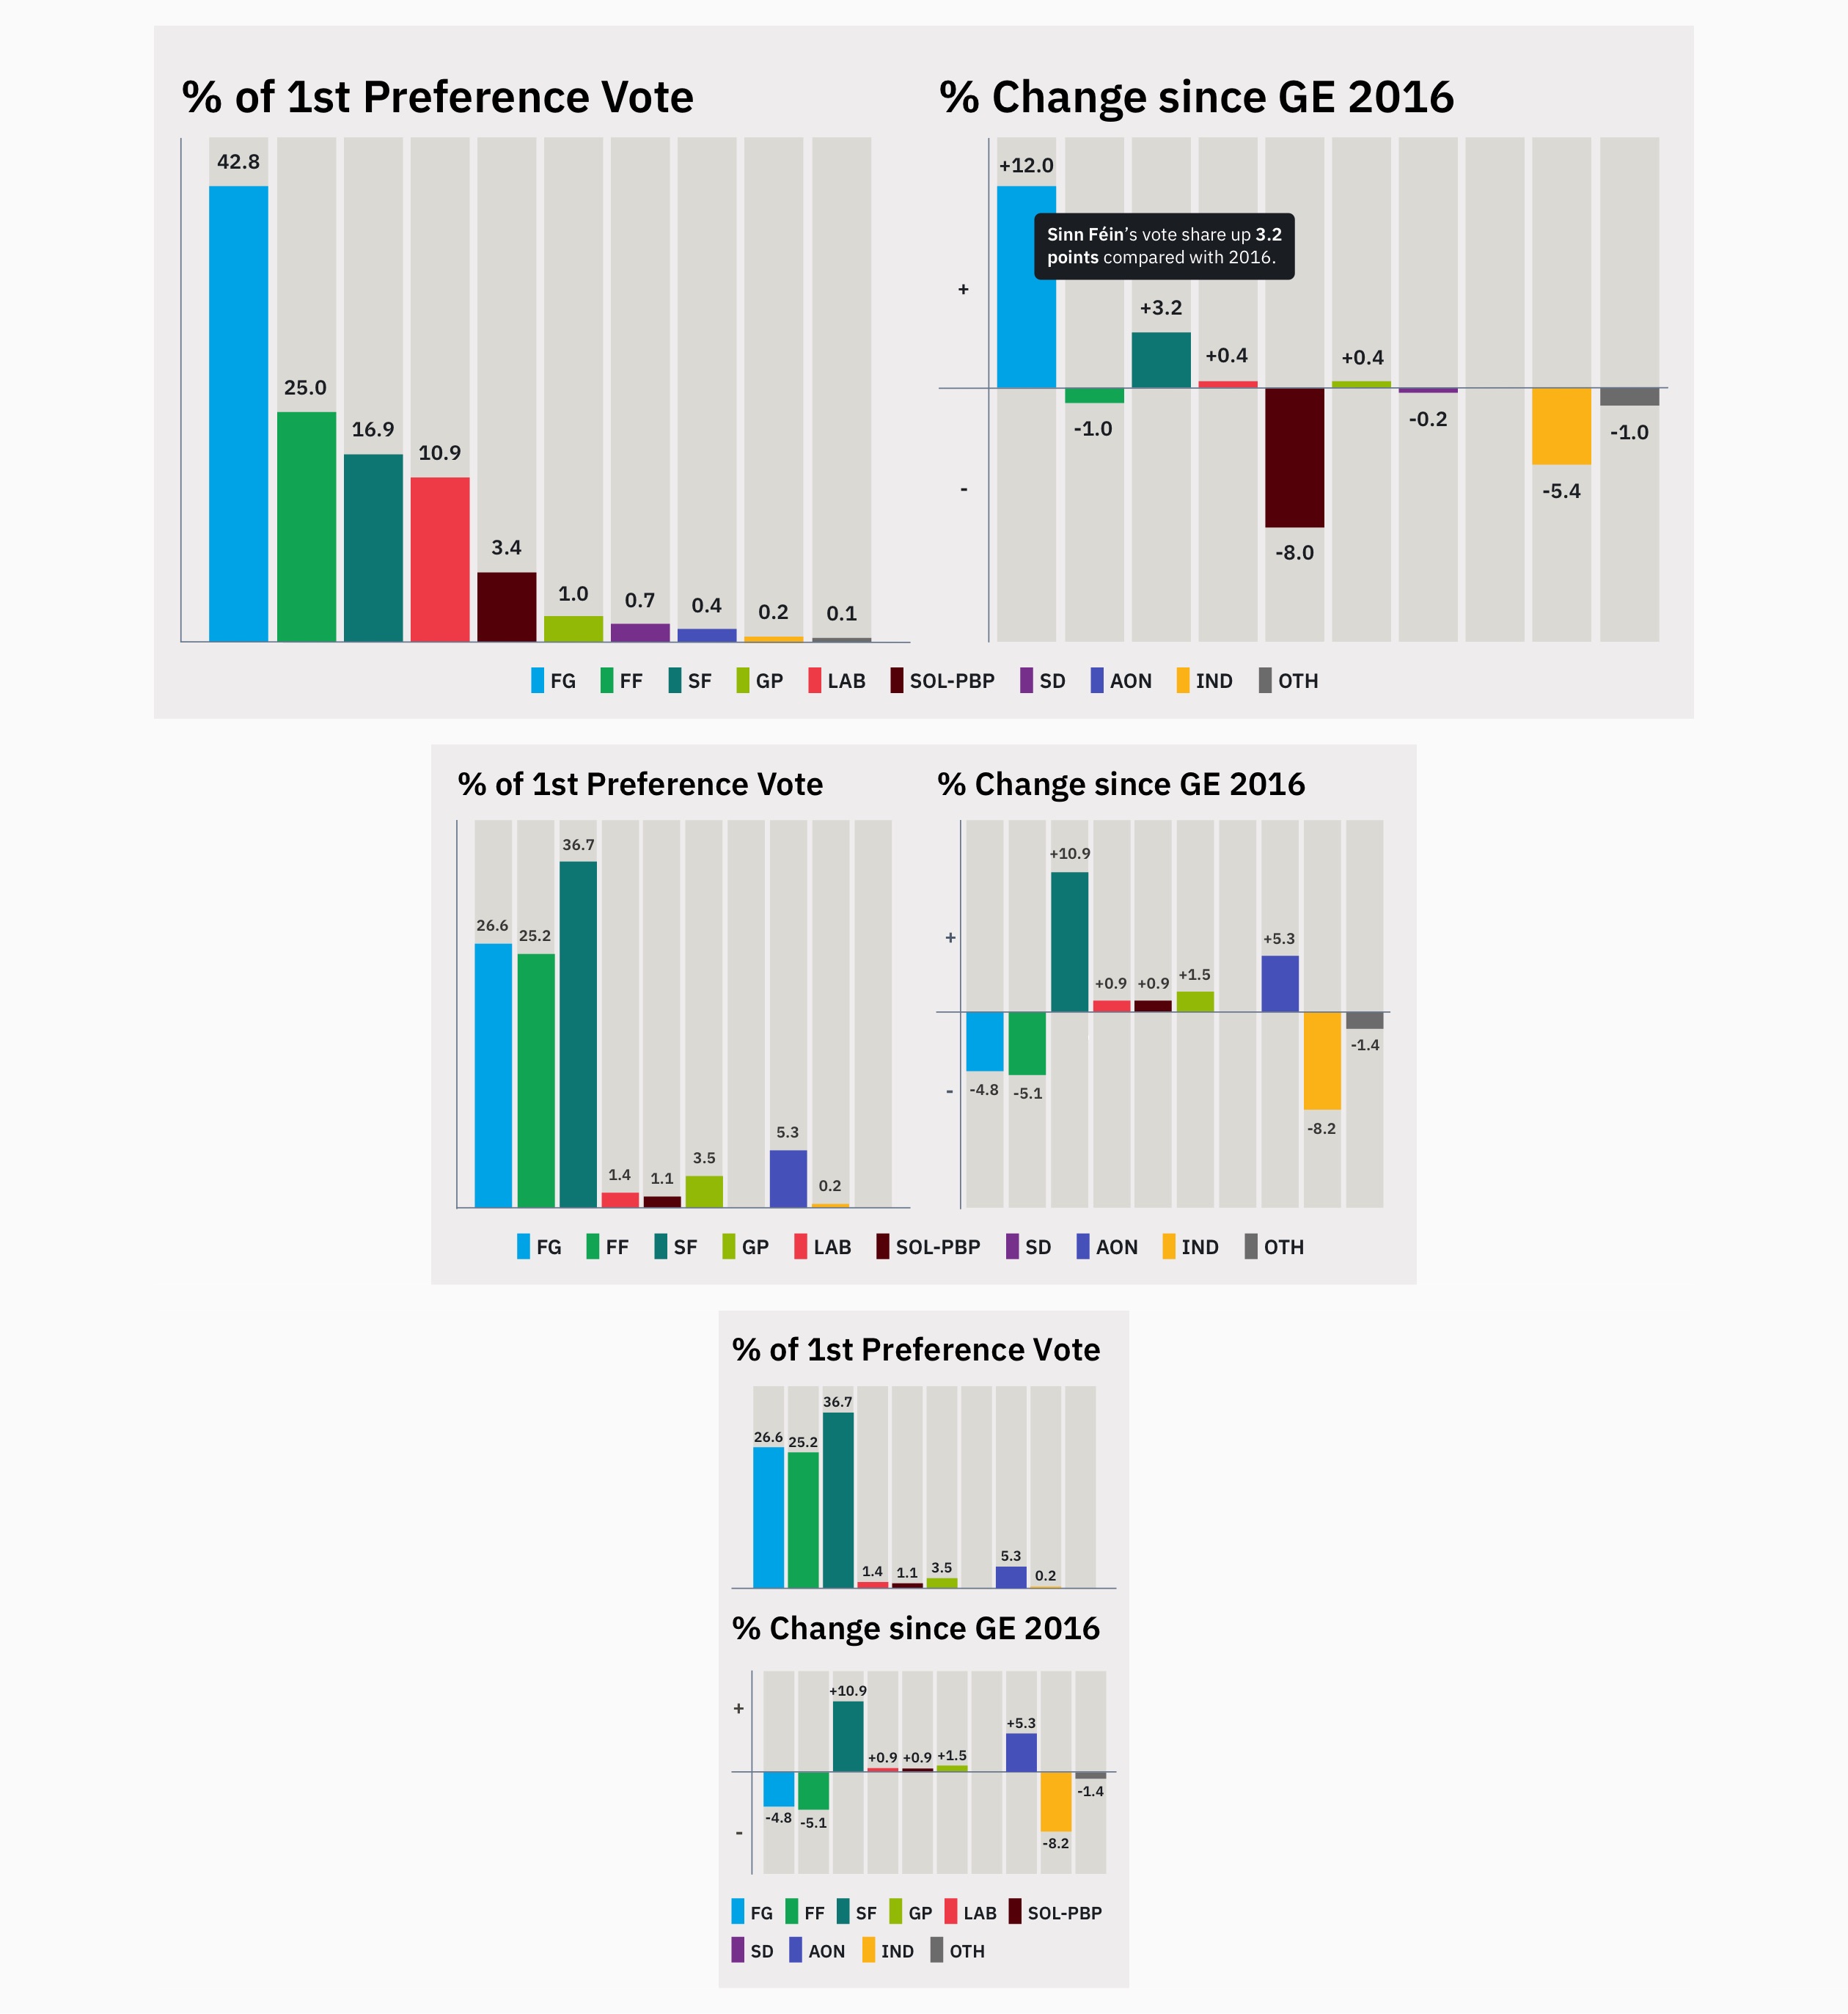
Responsive designs for the party first preference charts panel.
Live Updates Panel
The Live Updates panel gives users the latest count information from each constituency as it comes in, including recounts. New items added in the last 10 minutes are highlighted in yellow.
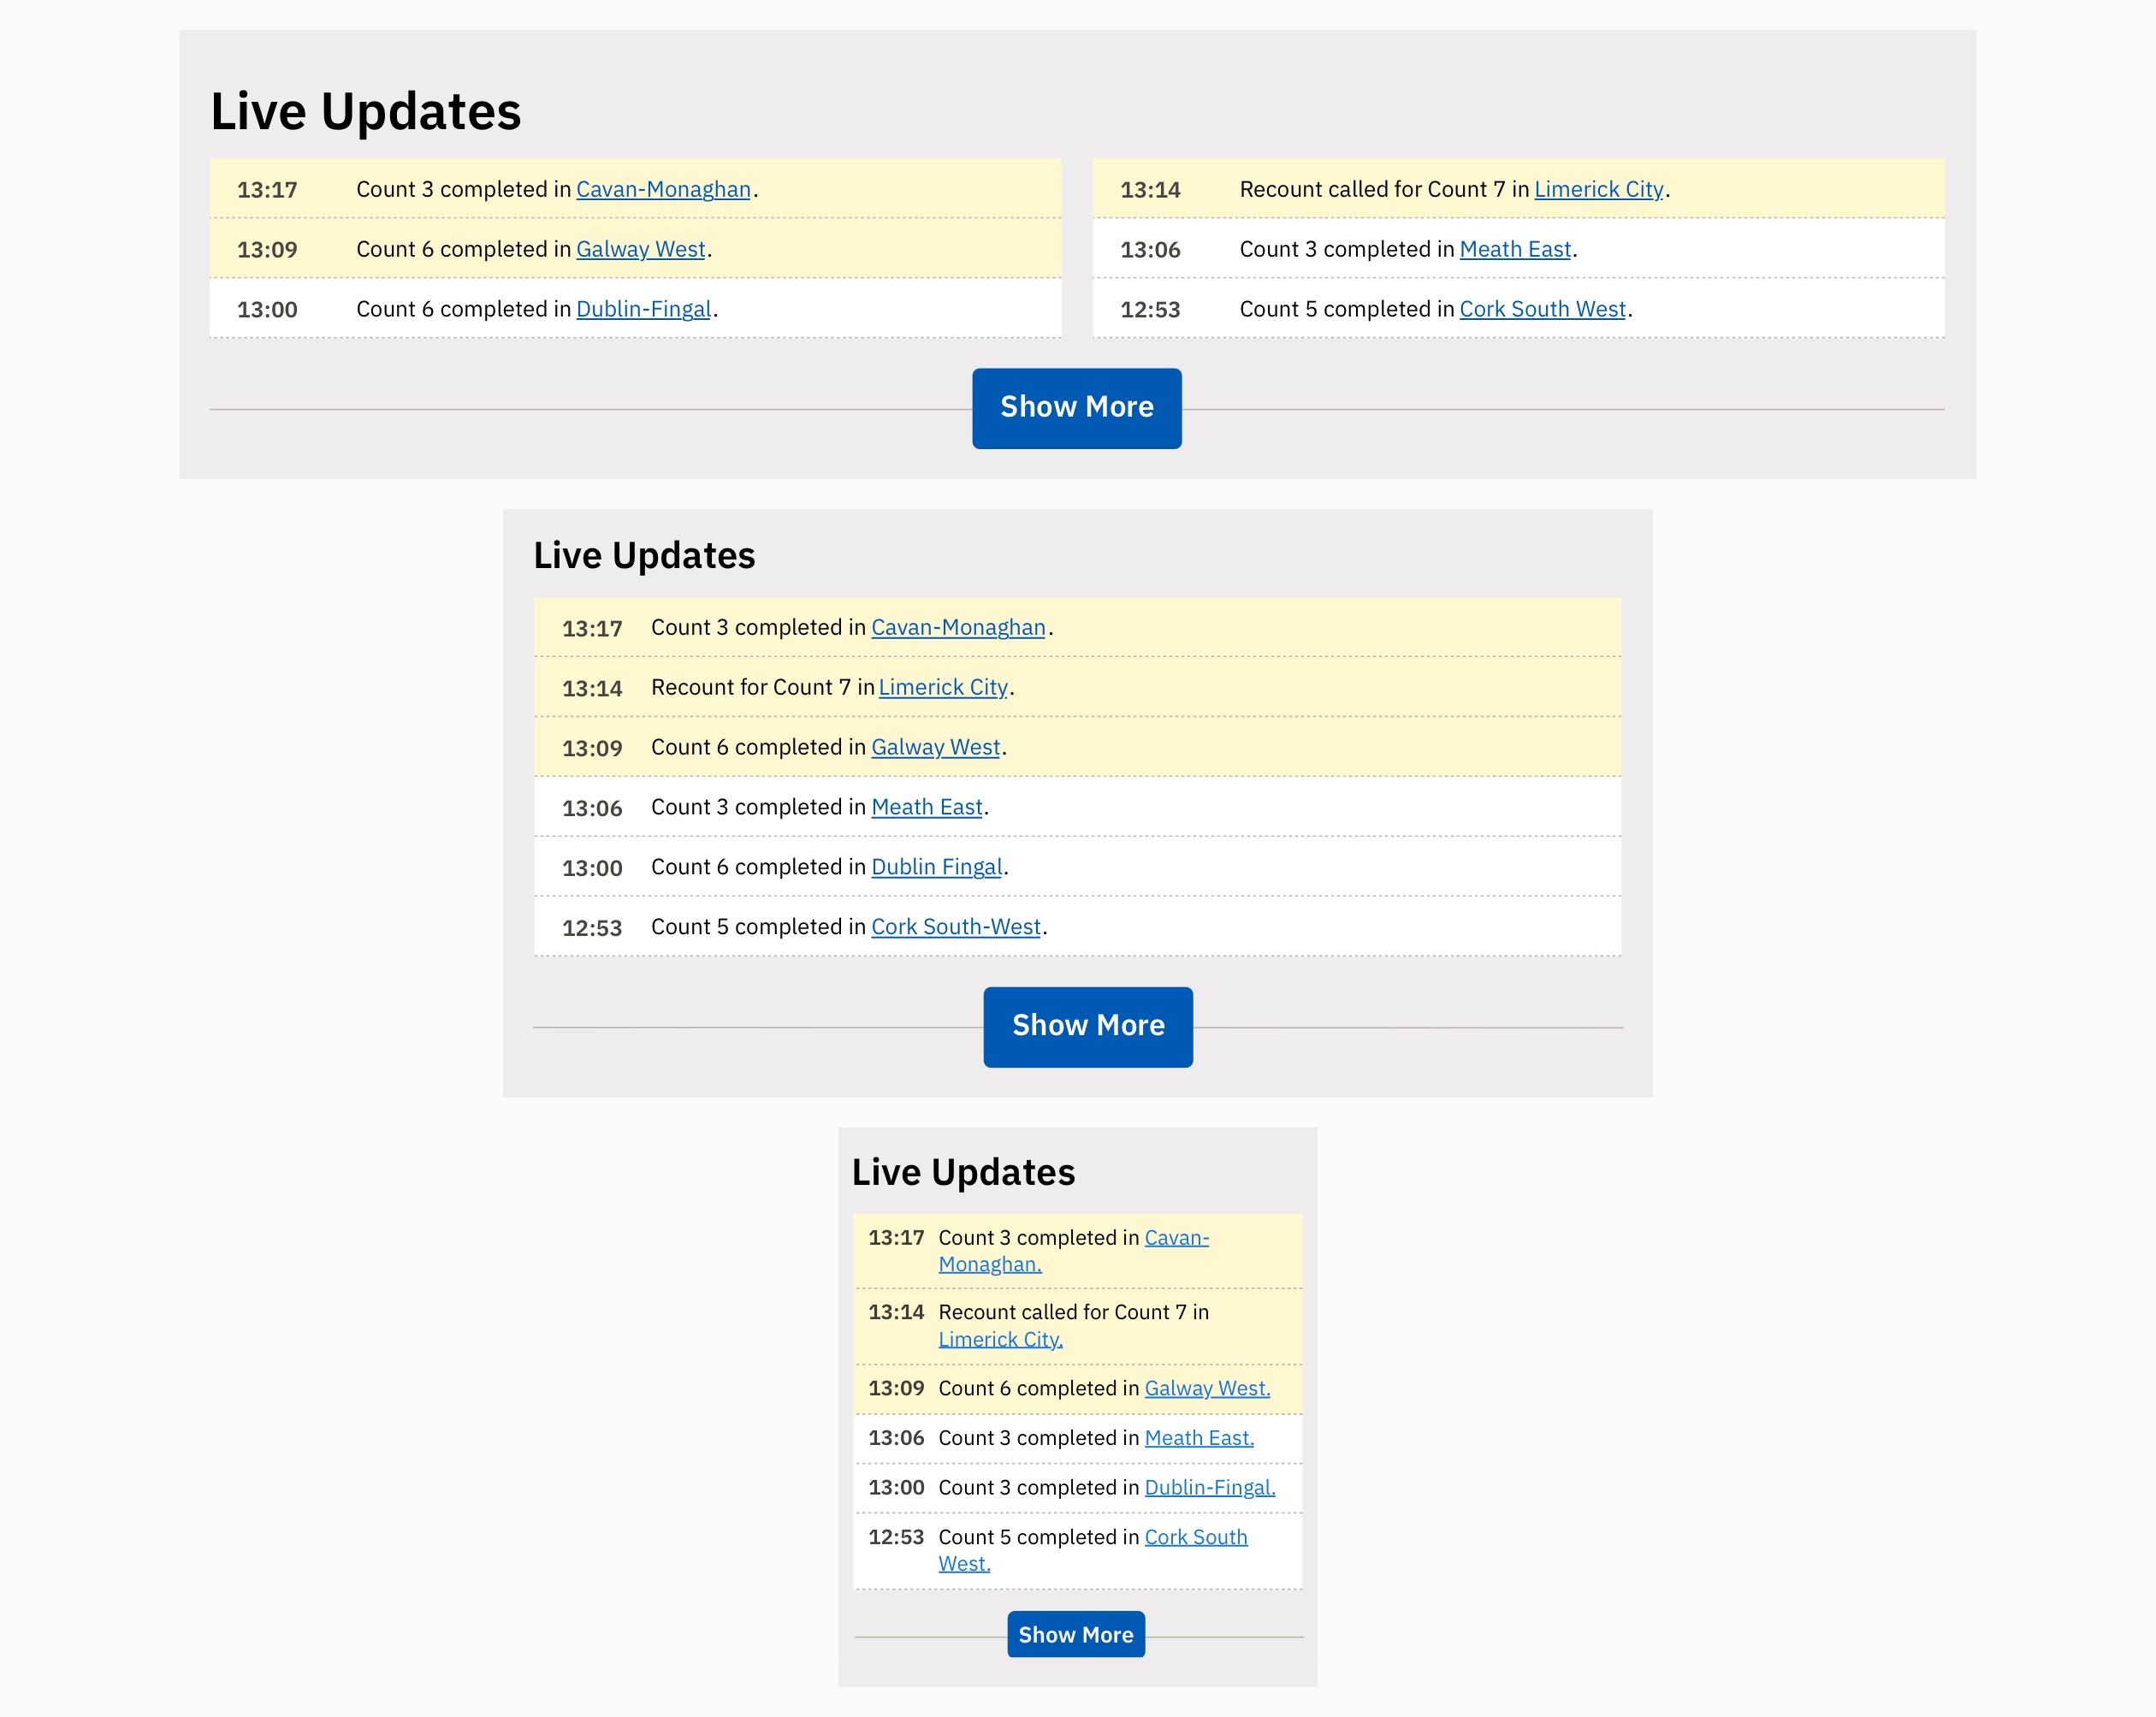
Responsive designs for the live updates panel.
Candidate Grid Panel
The Candidate Grid panel displays a grid of candidates, their name, party, votes received, first preference percentage and elected status with a link to the relevant count on the vote counter panel. Some details can be hidden in certain contexts. The panel can be filtered using dropdown menus and paginated using a ‘Show More’ button.
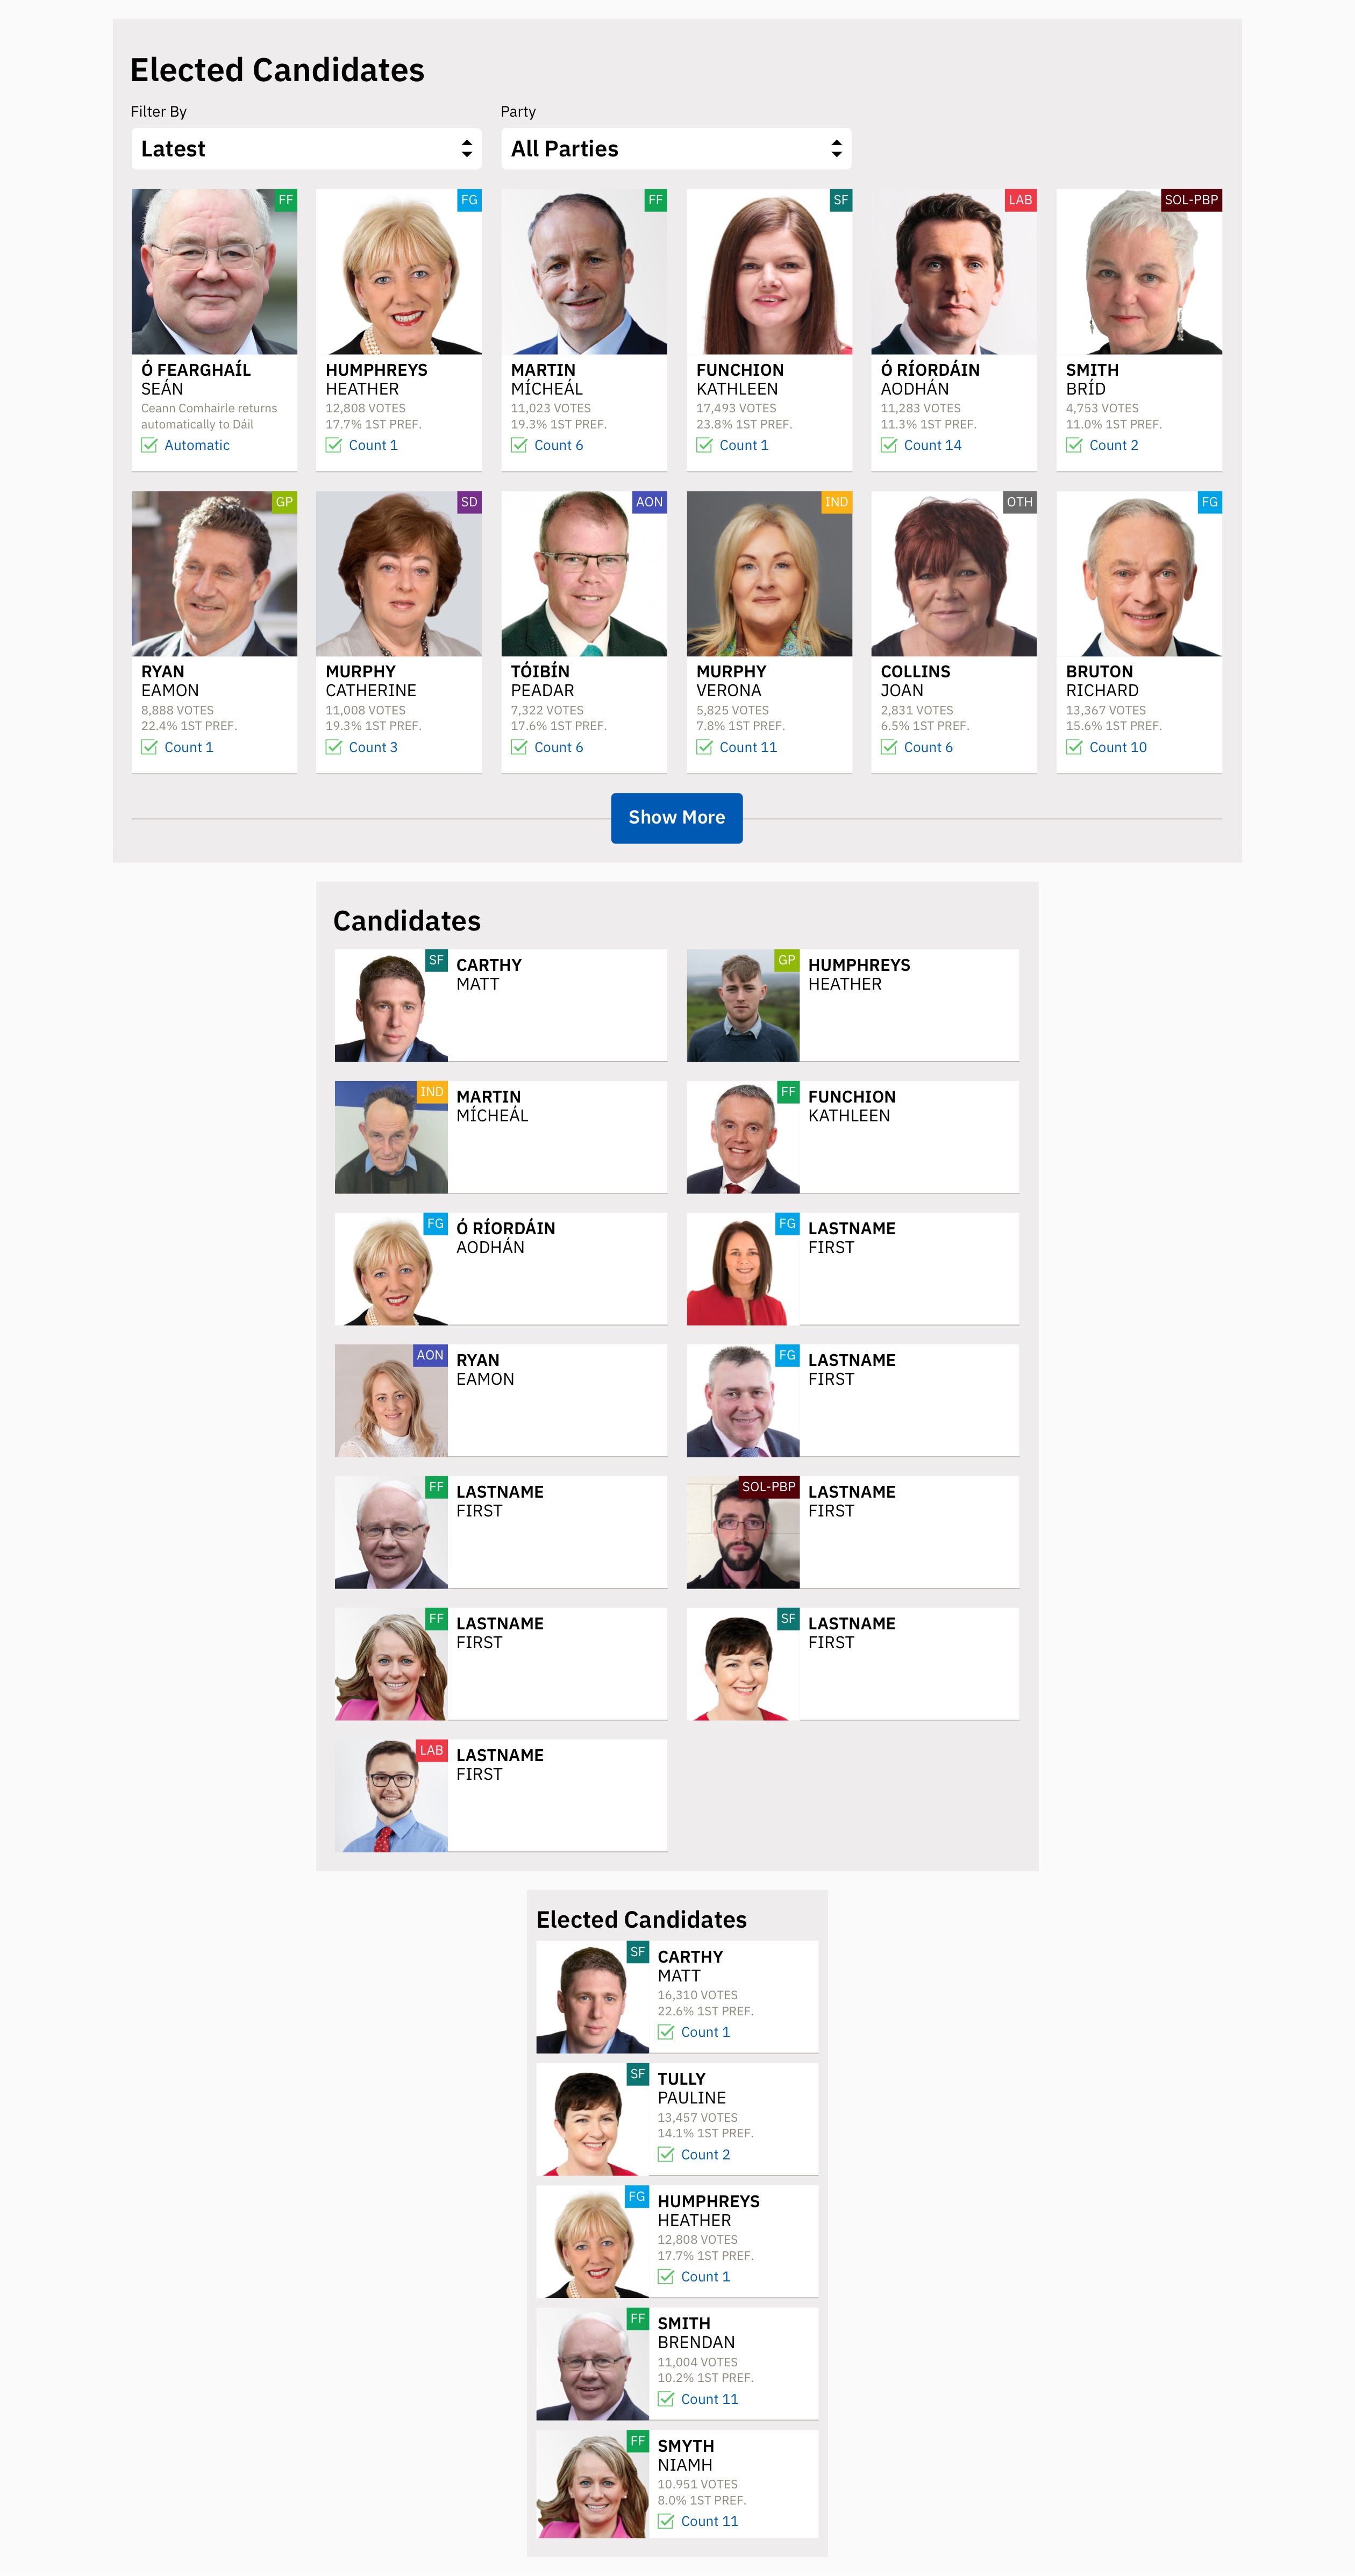
Responsive designs and variants of the candidate grid panel.
Vote Counter Panel
The Vote Counter panel allows users to see the number of votes each candidate has received per count. Users can navigate between previous counts to see how candidates progressed. Users can also see how surplus votes and excluded candidates’ votes are redistributed among other candidates.
Vote counter panel showing vote redistribution for a constituency.
Empty Panel States
From the time the polls close, empty states of the panels on the national and constituency results pages are displayed to signal to the user that live results will be available later. Some panels are hidden until they receive data.
Empty states for various Election results panels.
Before the Election
In the lead-up to election day, users can browse all national electoral constituencies and candidates in two different ways.
Constituency Profiles
The first is to use the constituency map or dropdown to view a constituency page, which displays a grid of candidates running in that constituency and a text profile of which candidates may likely win seats.
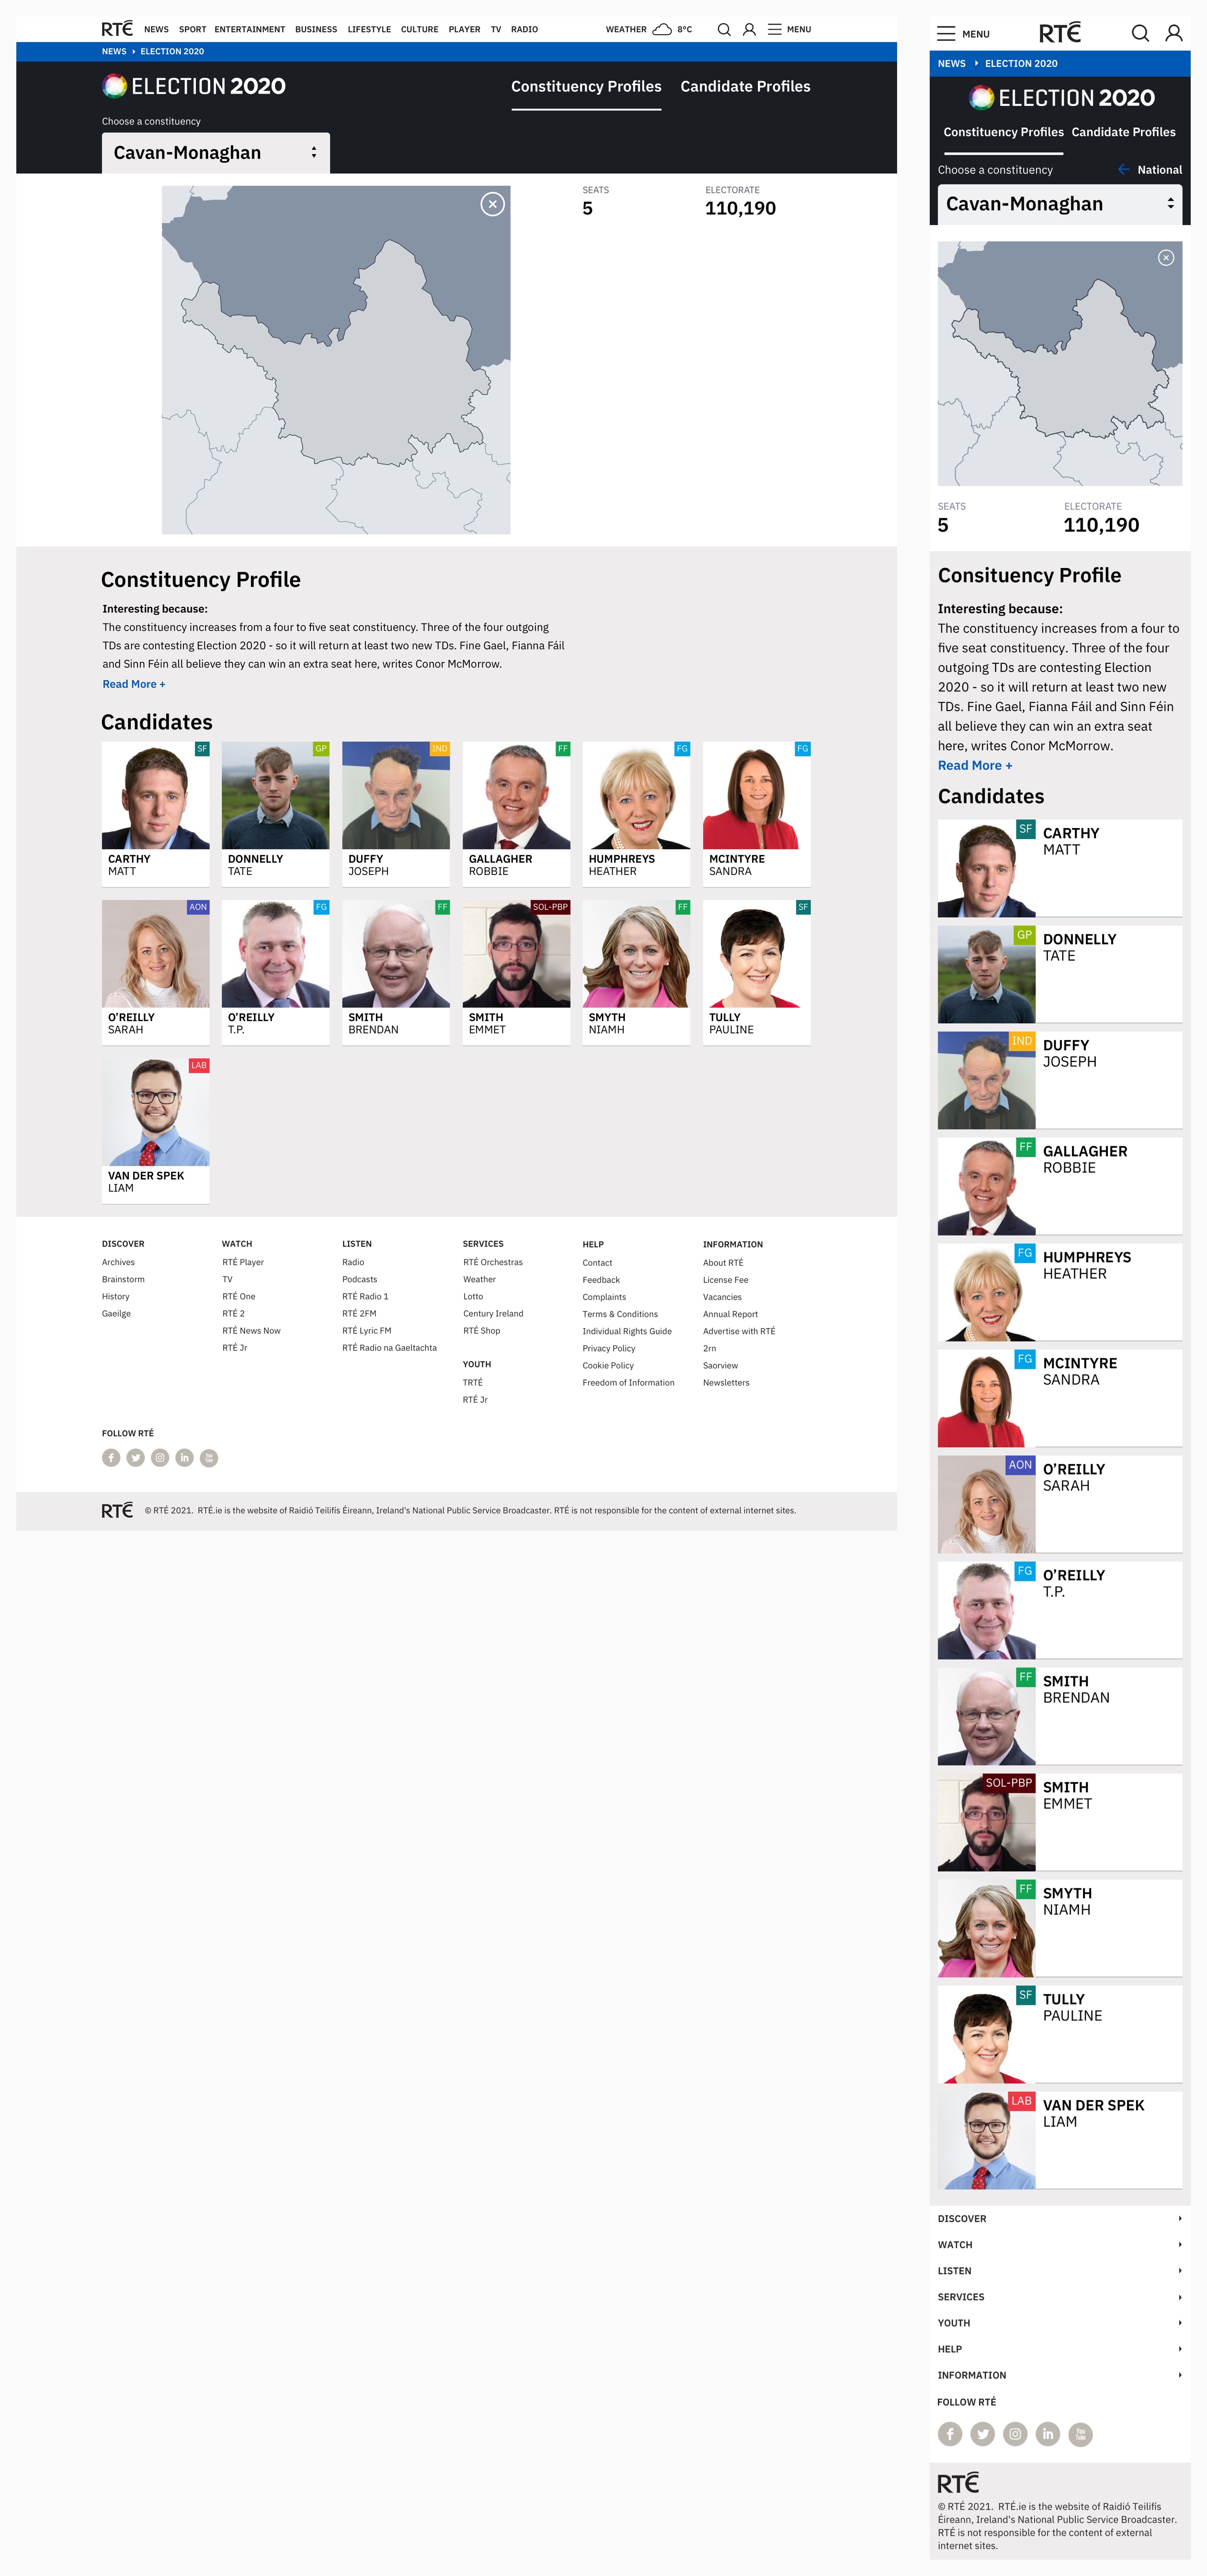
Desktop and mobile views of the constituency profile page.
Candidate Profiles
The second is to explore a national grid of candidates, filterable by constituency and party. This allows users to get a good overview of all of the candidates running in their constituency or for the party they support. If a user clicks a candidate, they can watch a video of the candidate (if provided), read a short summary of their political career and interact with their social links.
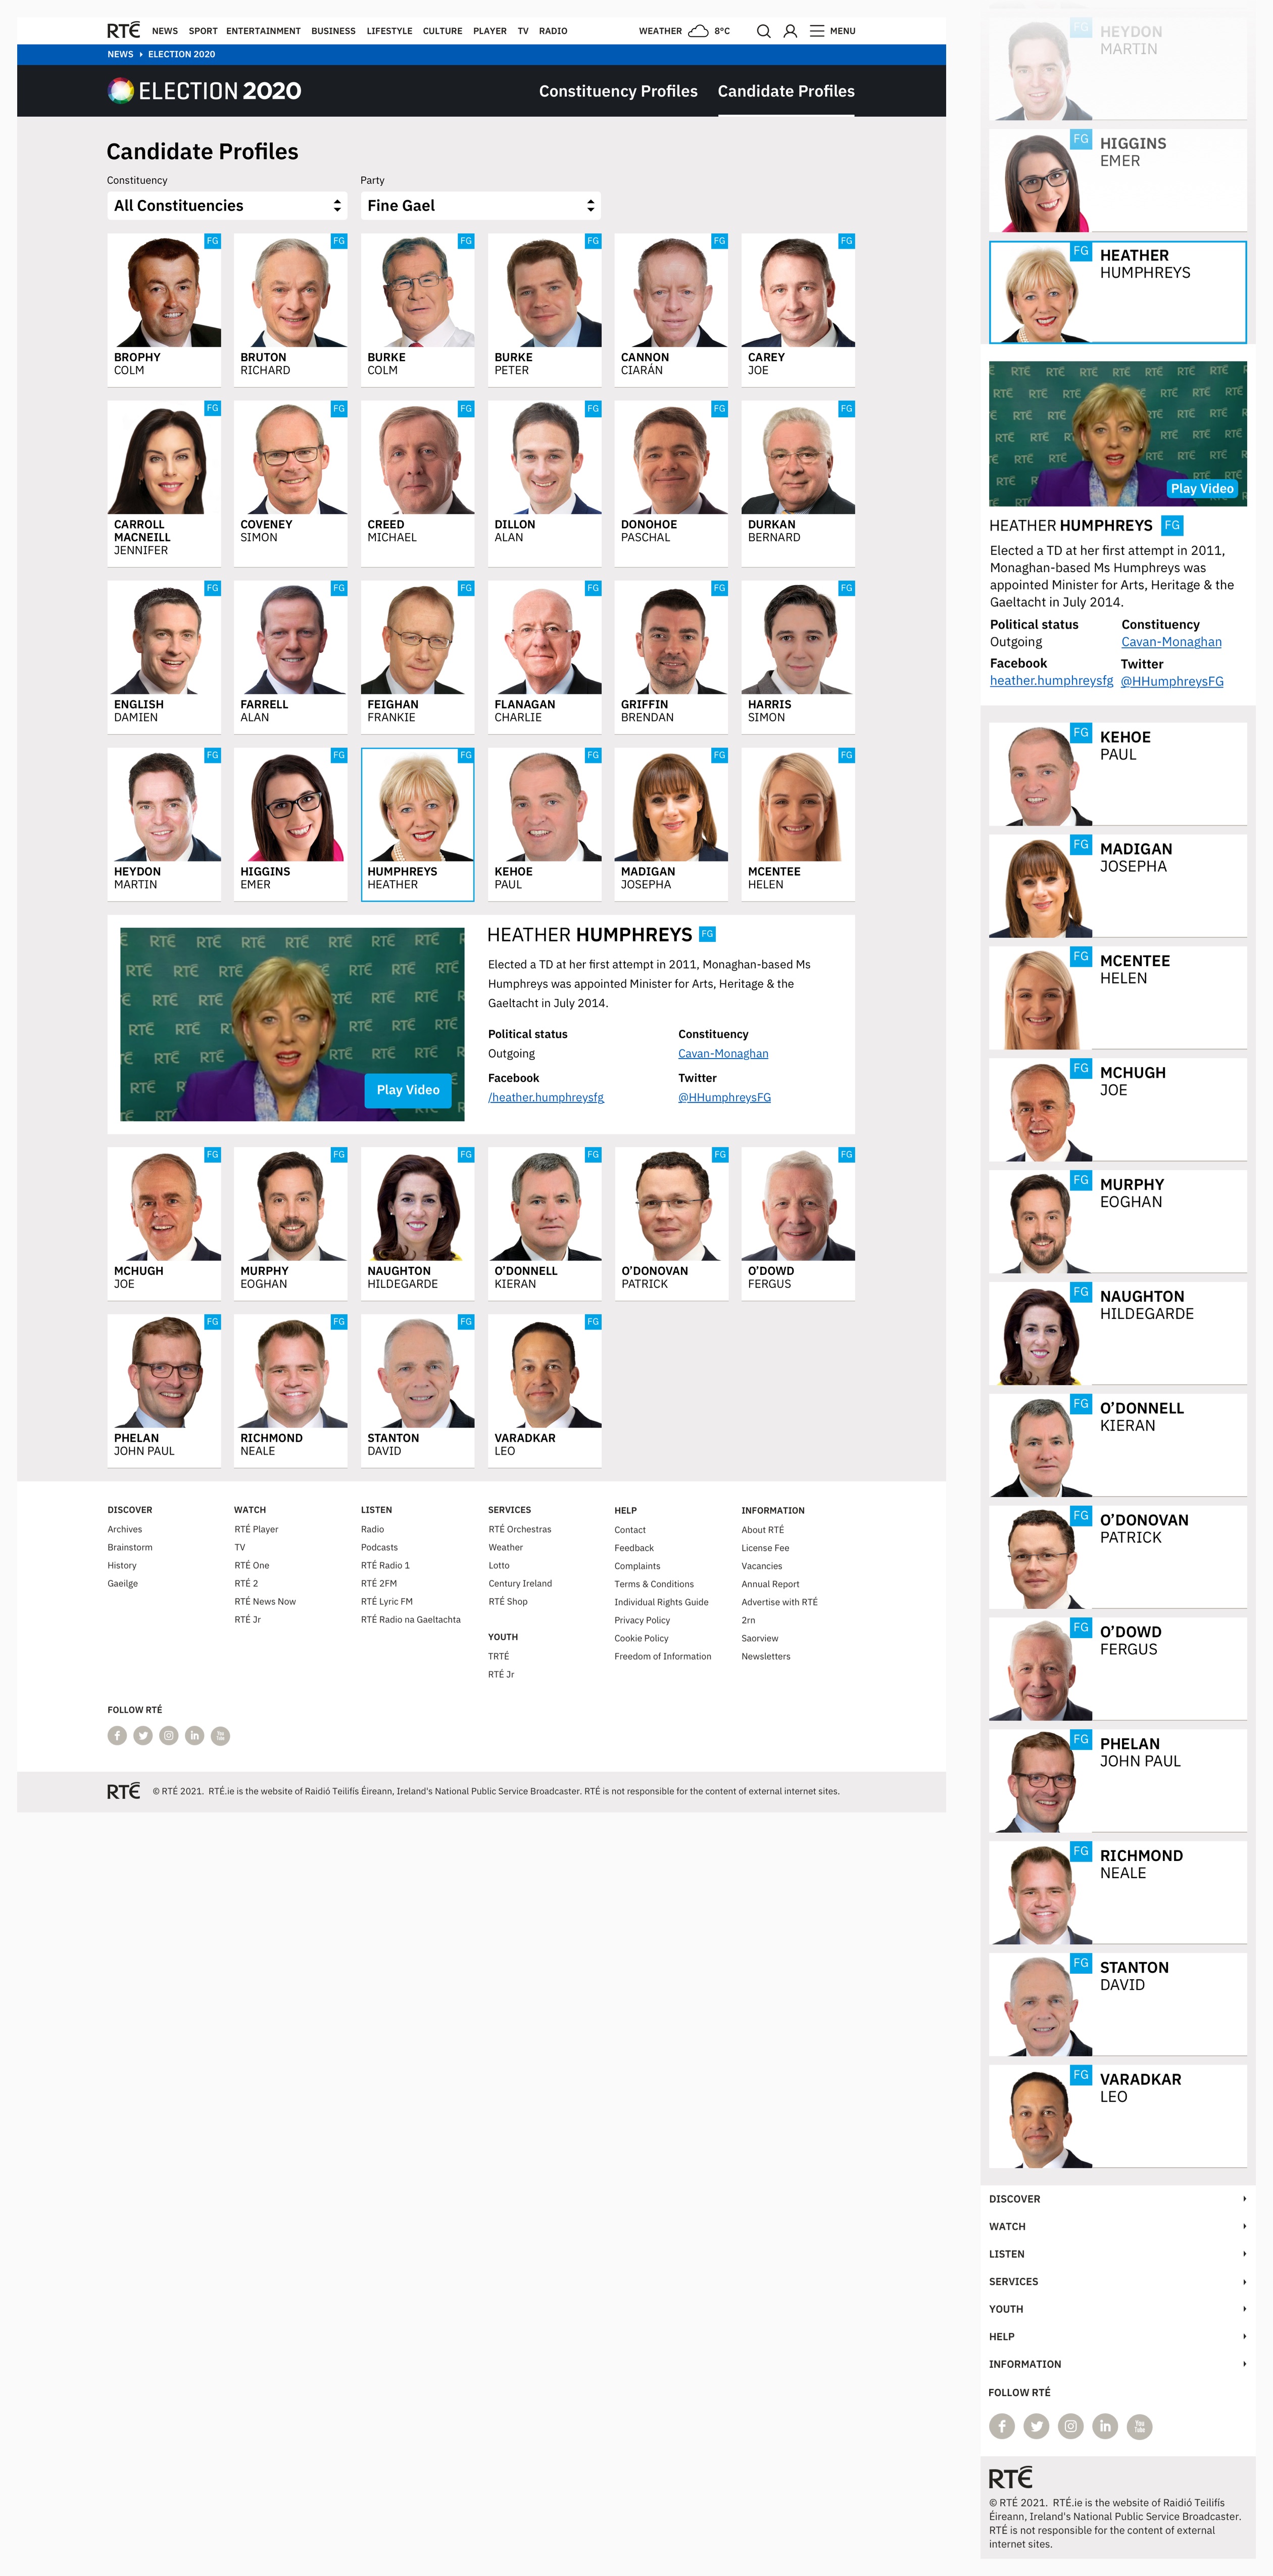
Desktop and mobile views of the candidate profiles page.
Election Results
After the polls close, the constituency and candidate profiles are replaced with live national and constituency results views.
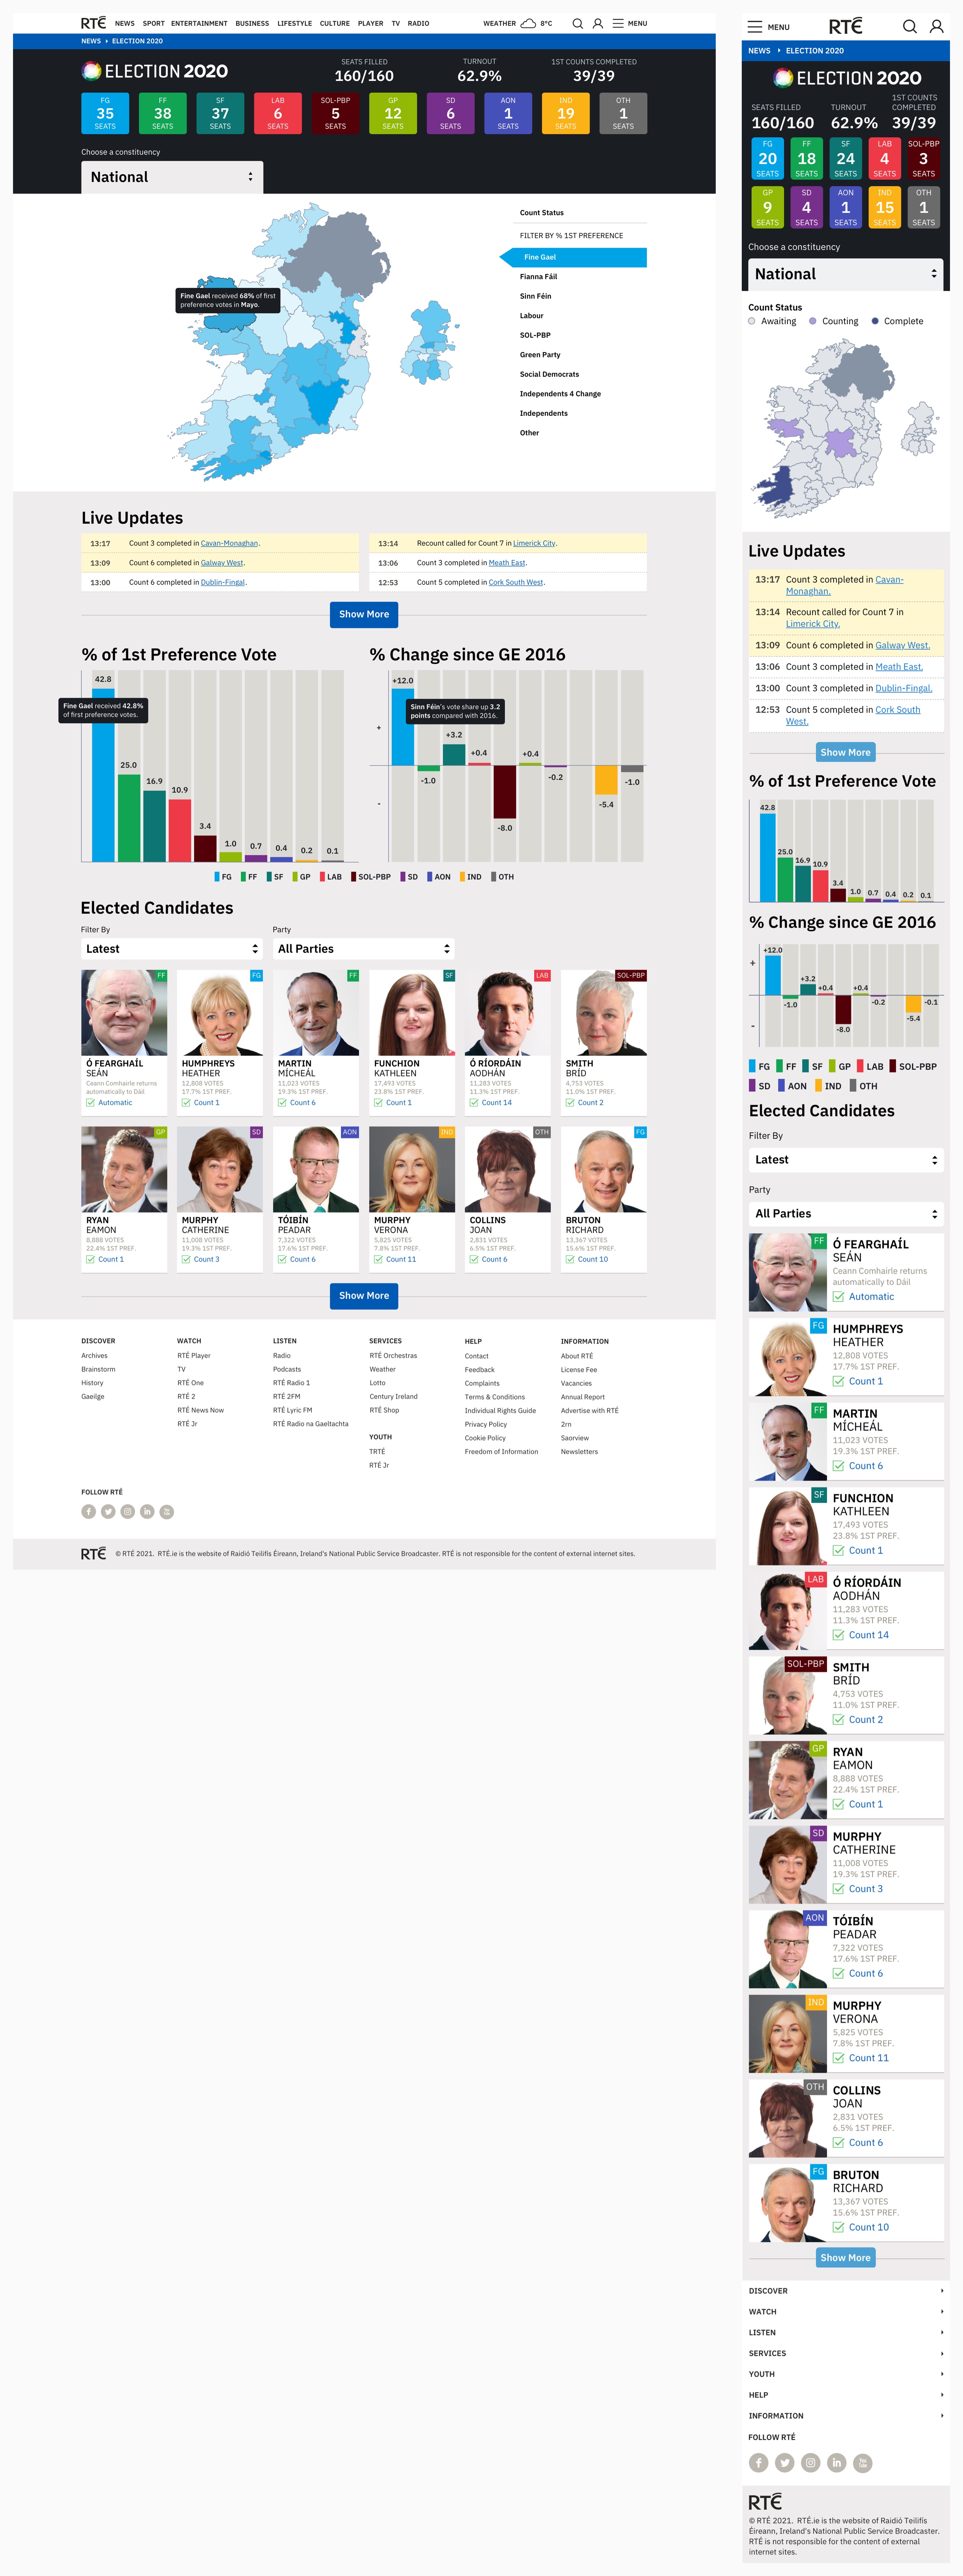
National Results
Here is an example of how the national results page looks populated with live data – it includes the seat counter, constituency dropdown, constituency map, live updates, party first preference and candidate grid panels.
Constituency Results
When a constituency is chosen via the dropdown or map on the national results view, the user is brought to that constituency results view.
Here is an example of how a constituency results page looks populated with live data – it includes the seat counter, constituency dropdown, constituency map, party first preference, candidate grid, vote counter and constituency profile panels.
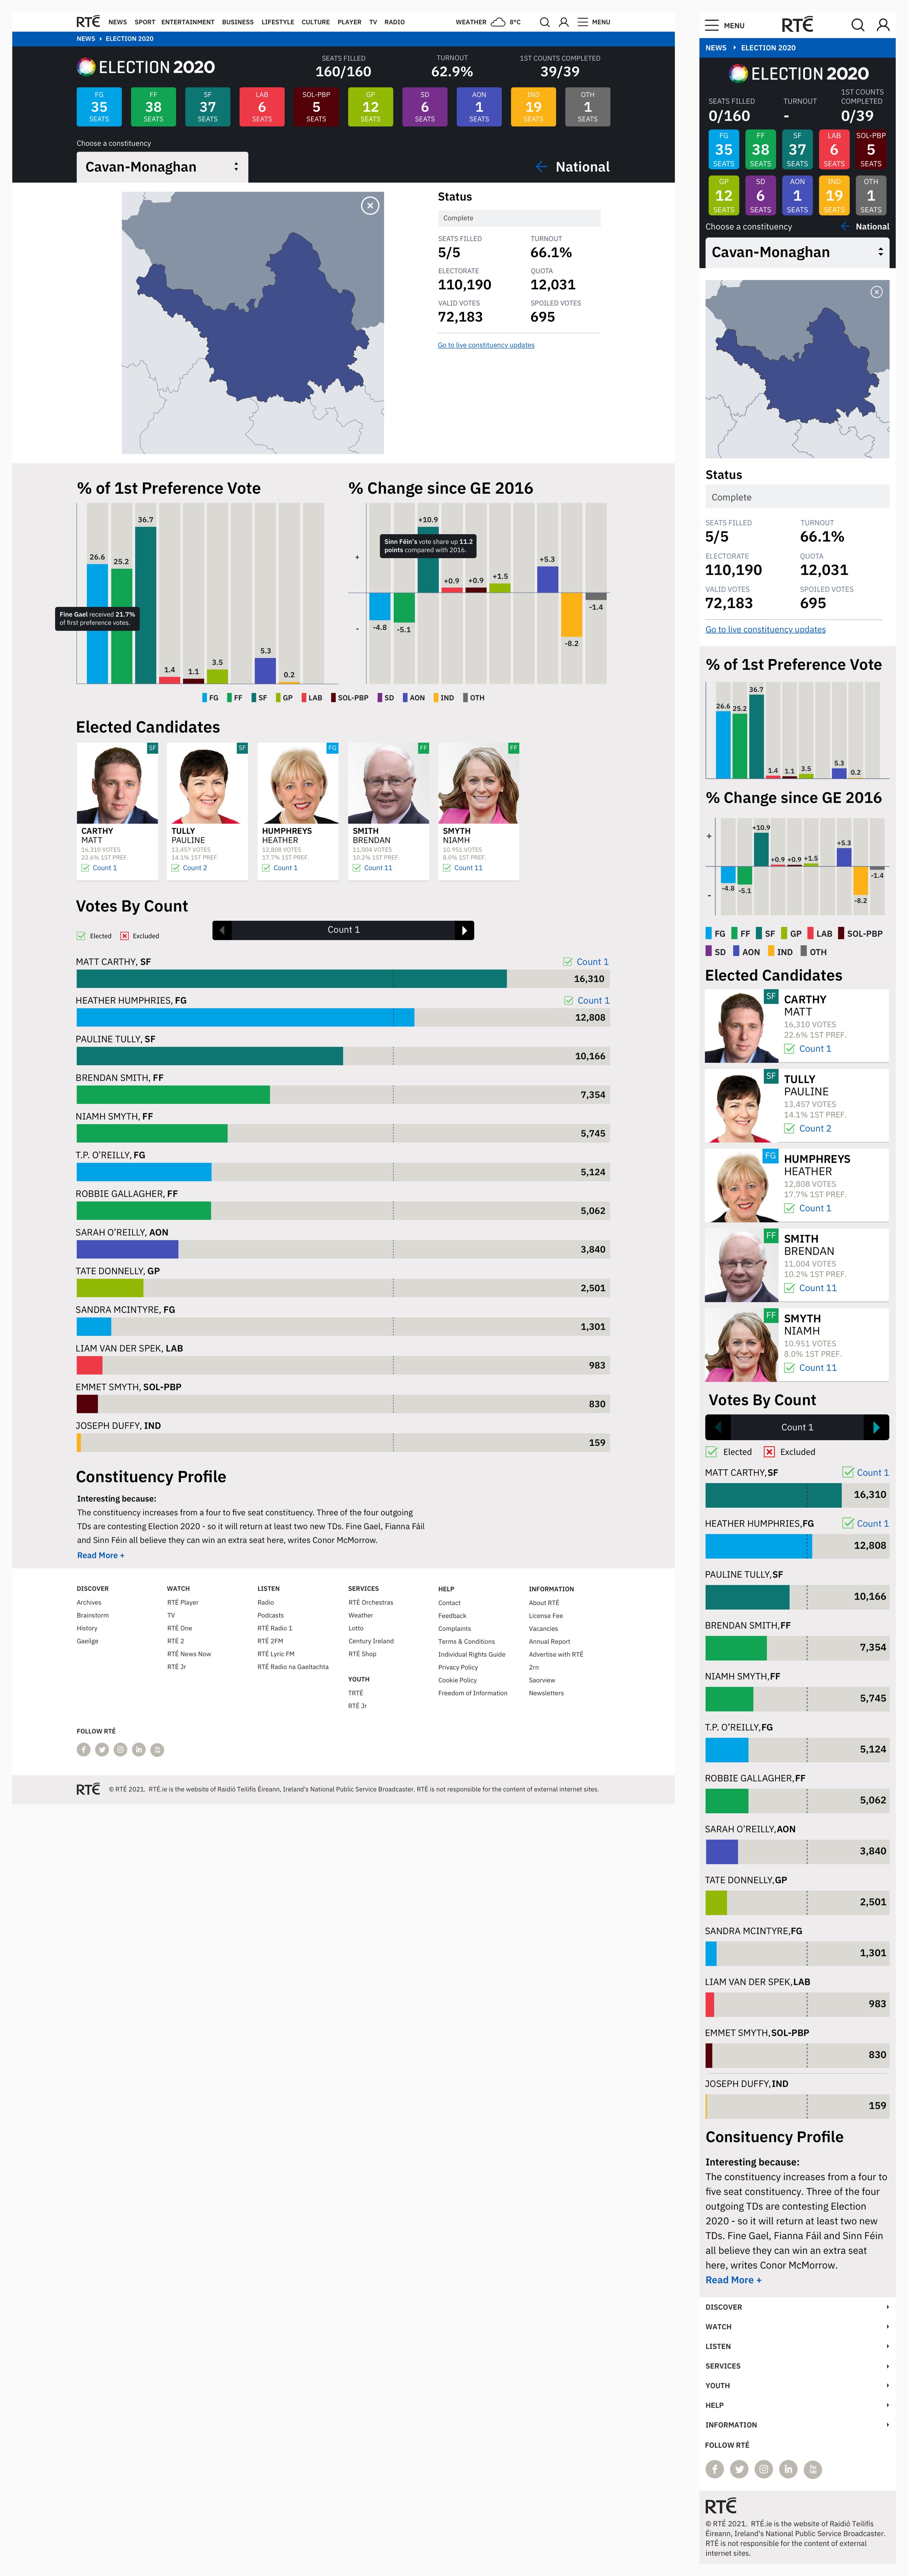
Desktop and mobile views for constituency results.
Election Live Trackers
The live tracker template on rte.ie allows journalists to post short updates in real time, which is the perfect format for election coverage. For elections, we add the constituency dropdown panel to the tracker so people can view updates on a national level or choose a specific constituency. Users can visit the live tracker for their constituency from the constituency results page.
Desktop and mobile views of an election live tracker.
Other Elections
All the panels seen above and lots of variants were designed for use not just for General Elections, but also for Local, European, Northern Ireland Assembly and Presidential Elections over the last few years. This allowed us to make updates along the way to improve and extend the usability of each panel. You can see some earlier iterations and variations of panels below.
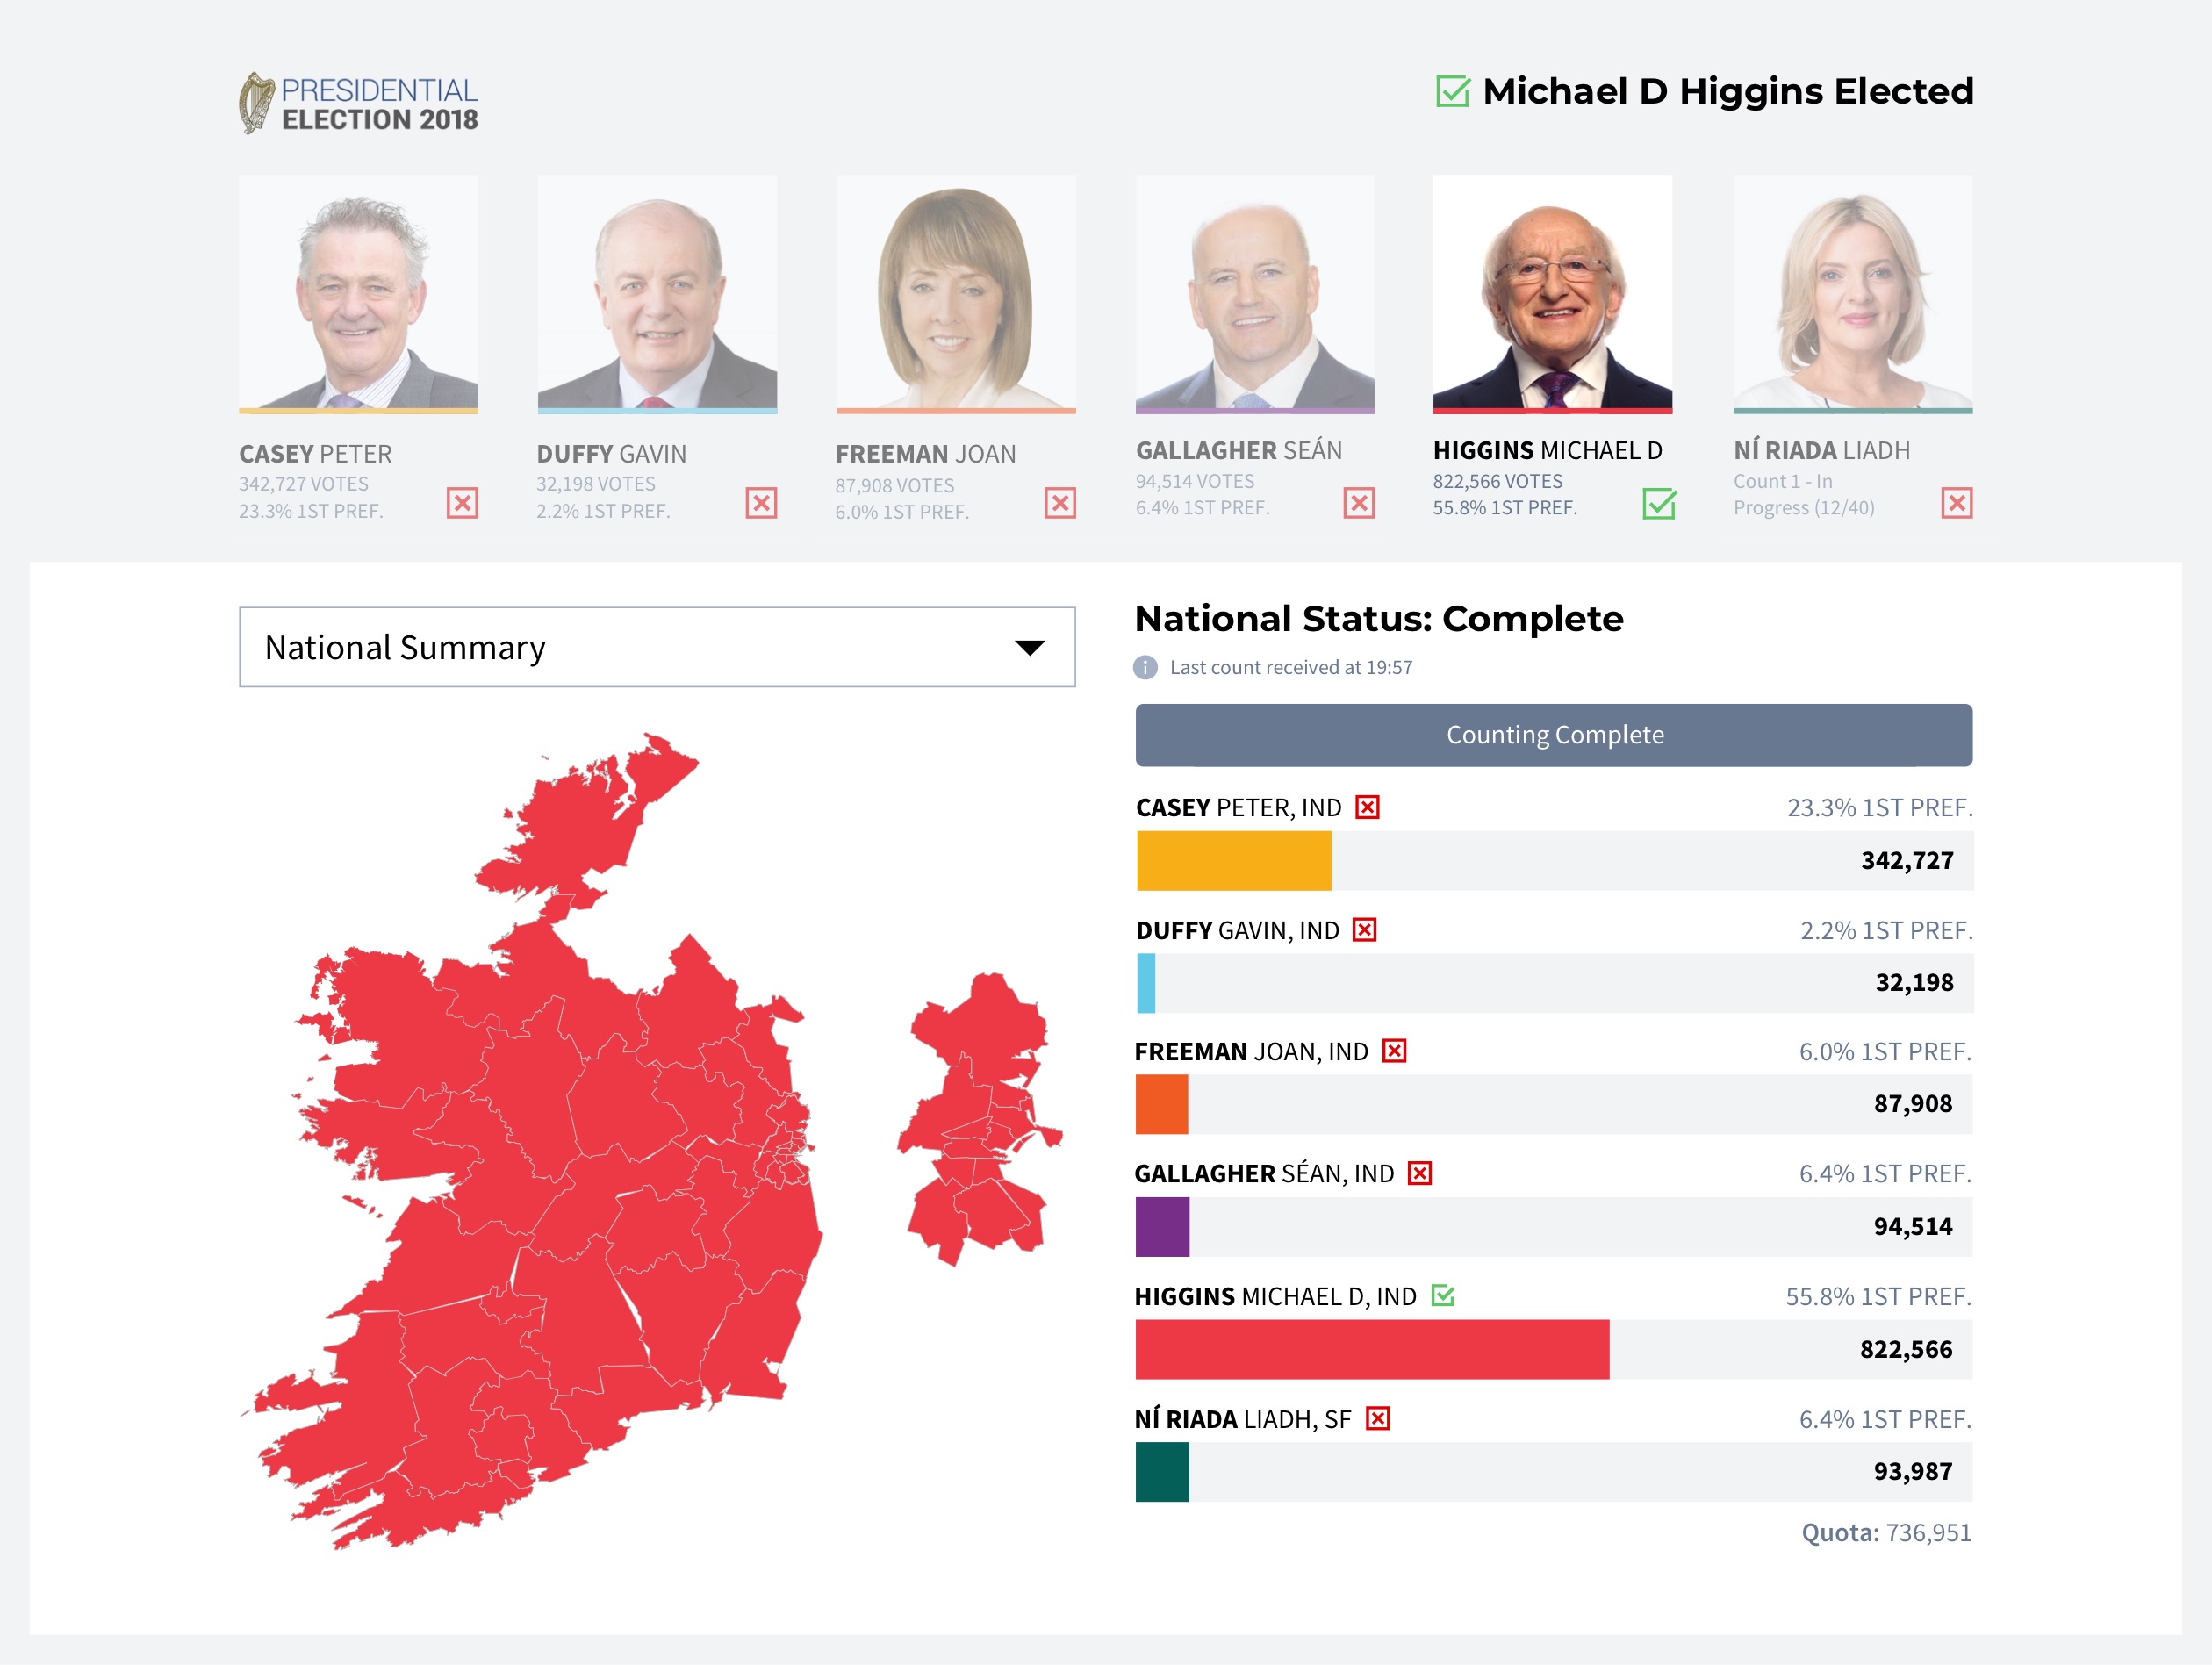
Desktop view of the Presidential Election results in 2018.
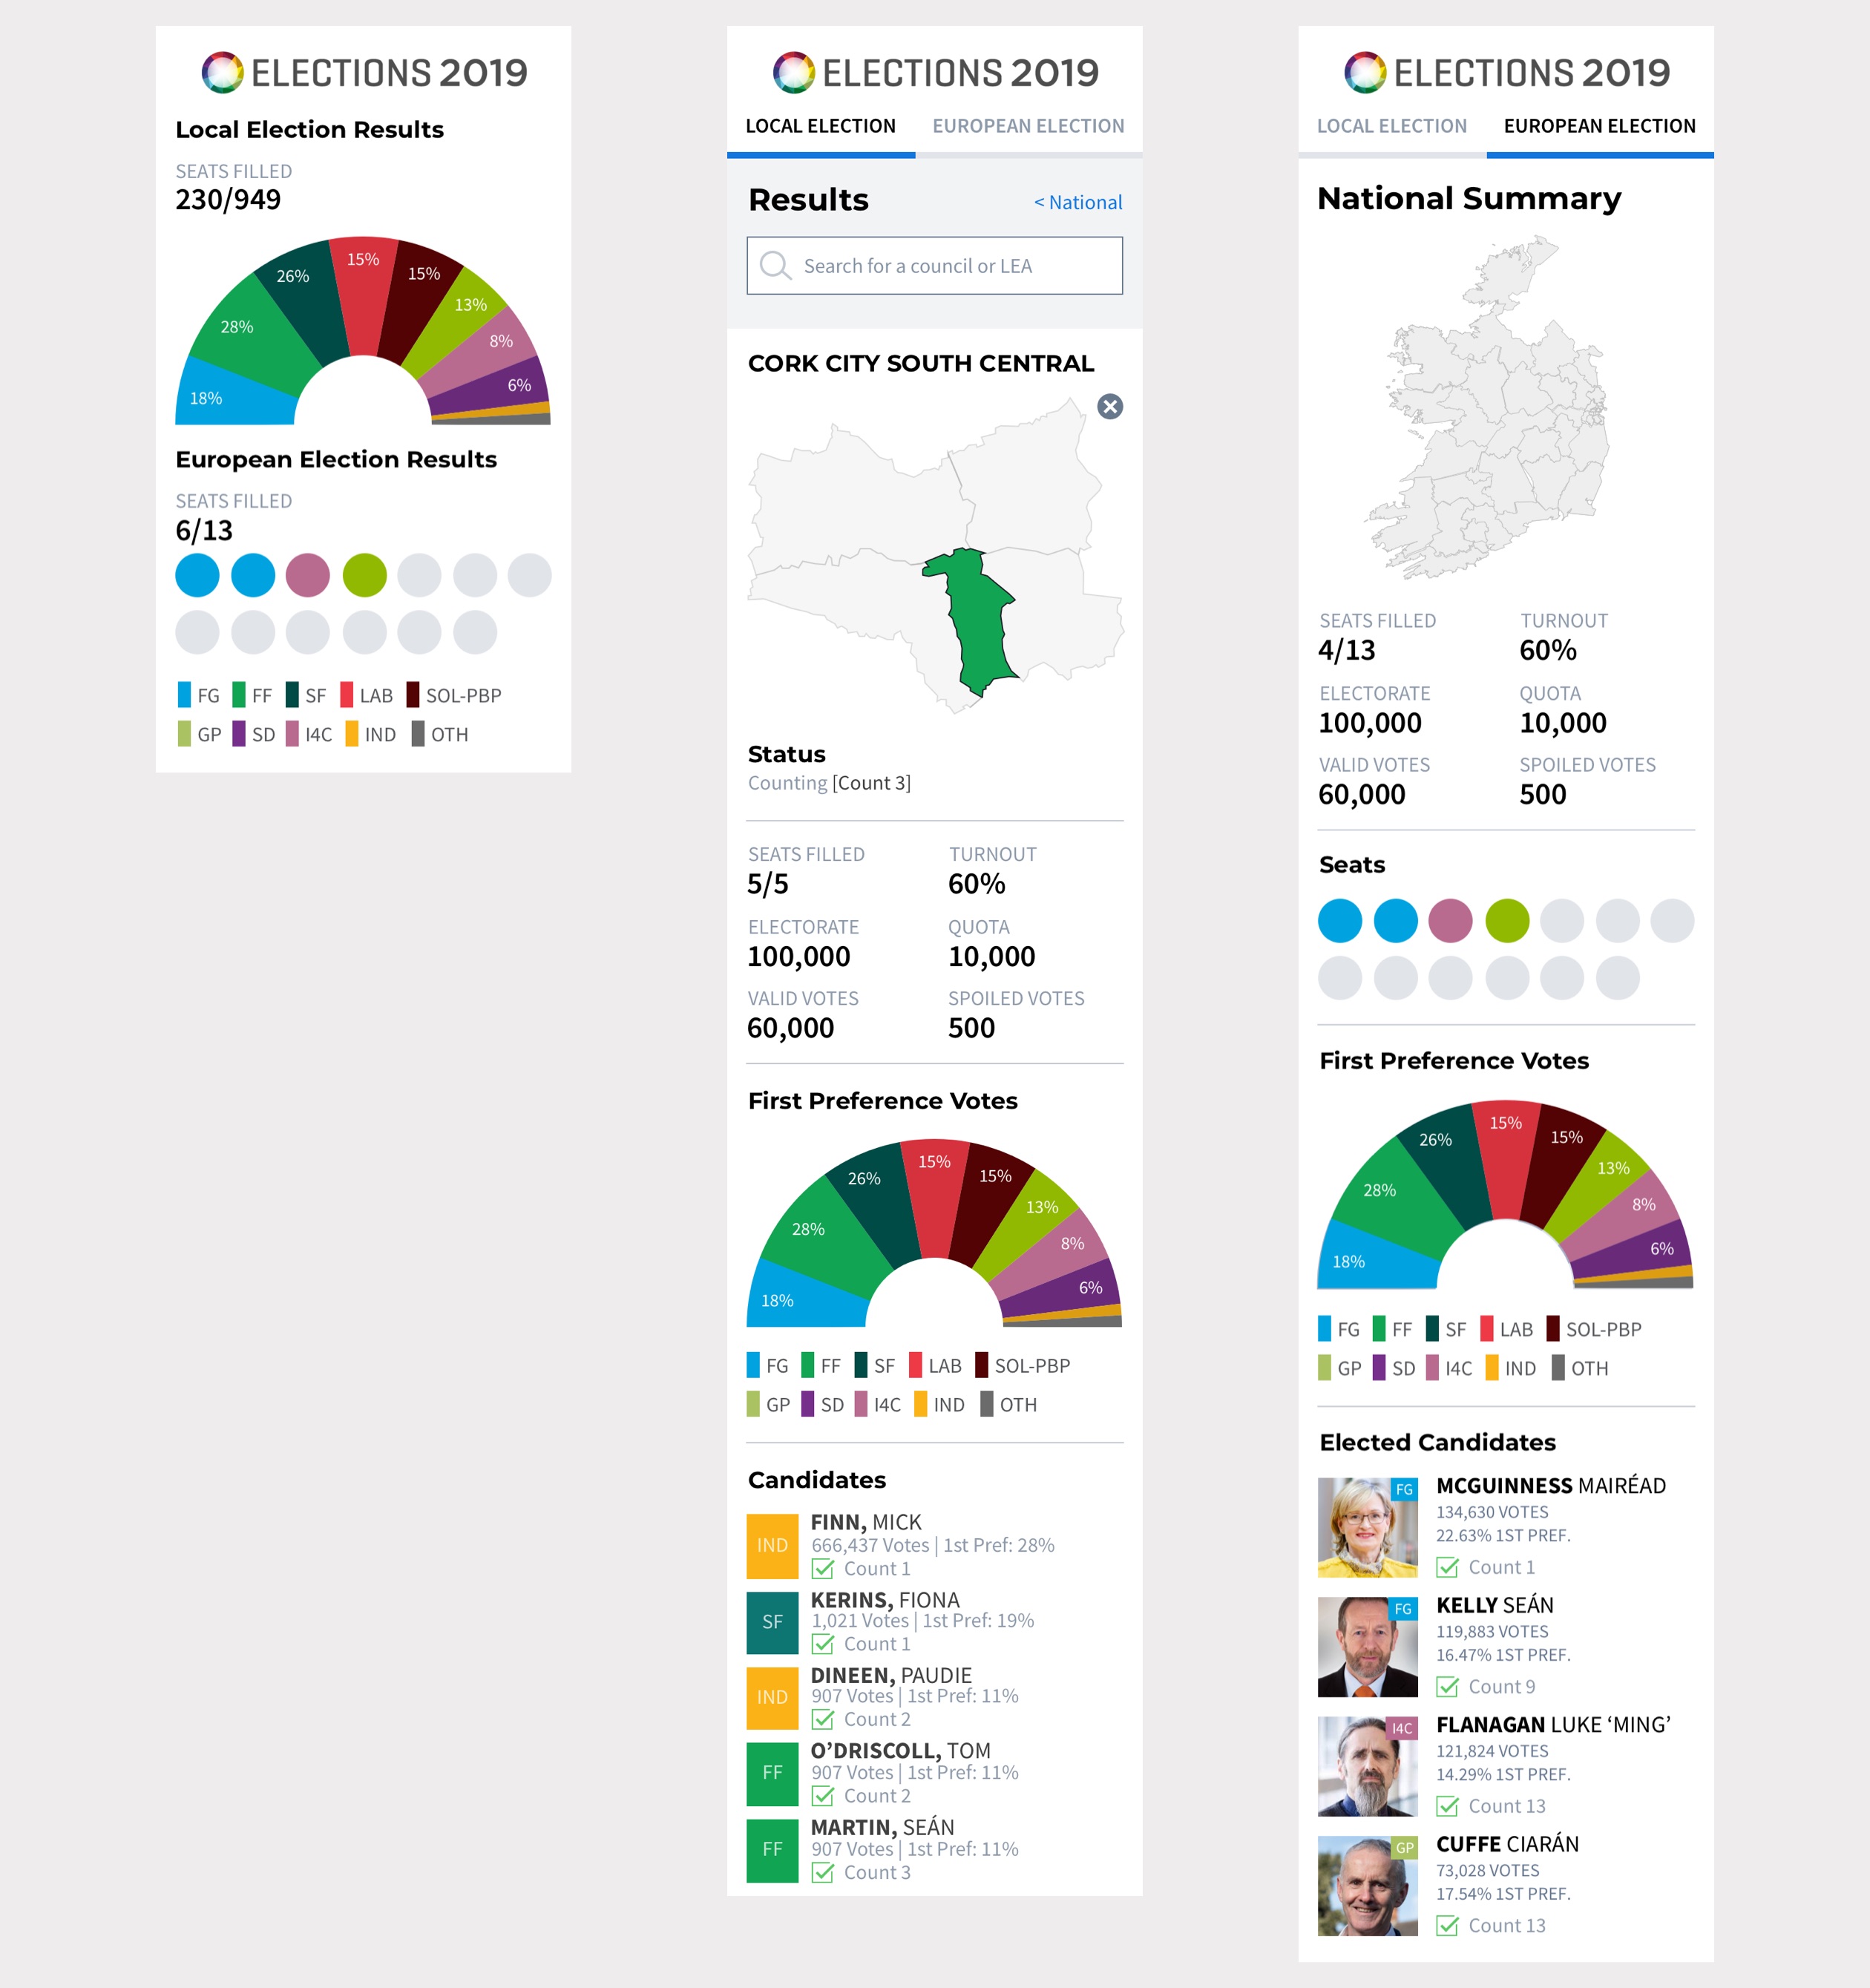
Mobile views of the Local and European Election results in 2019.
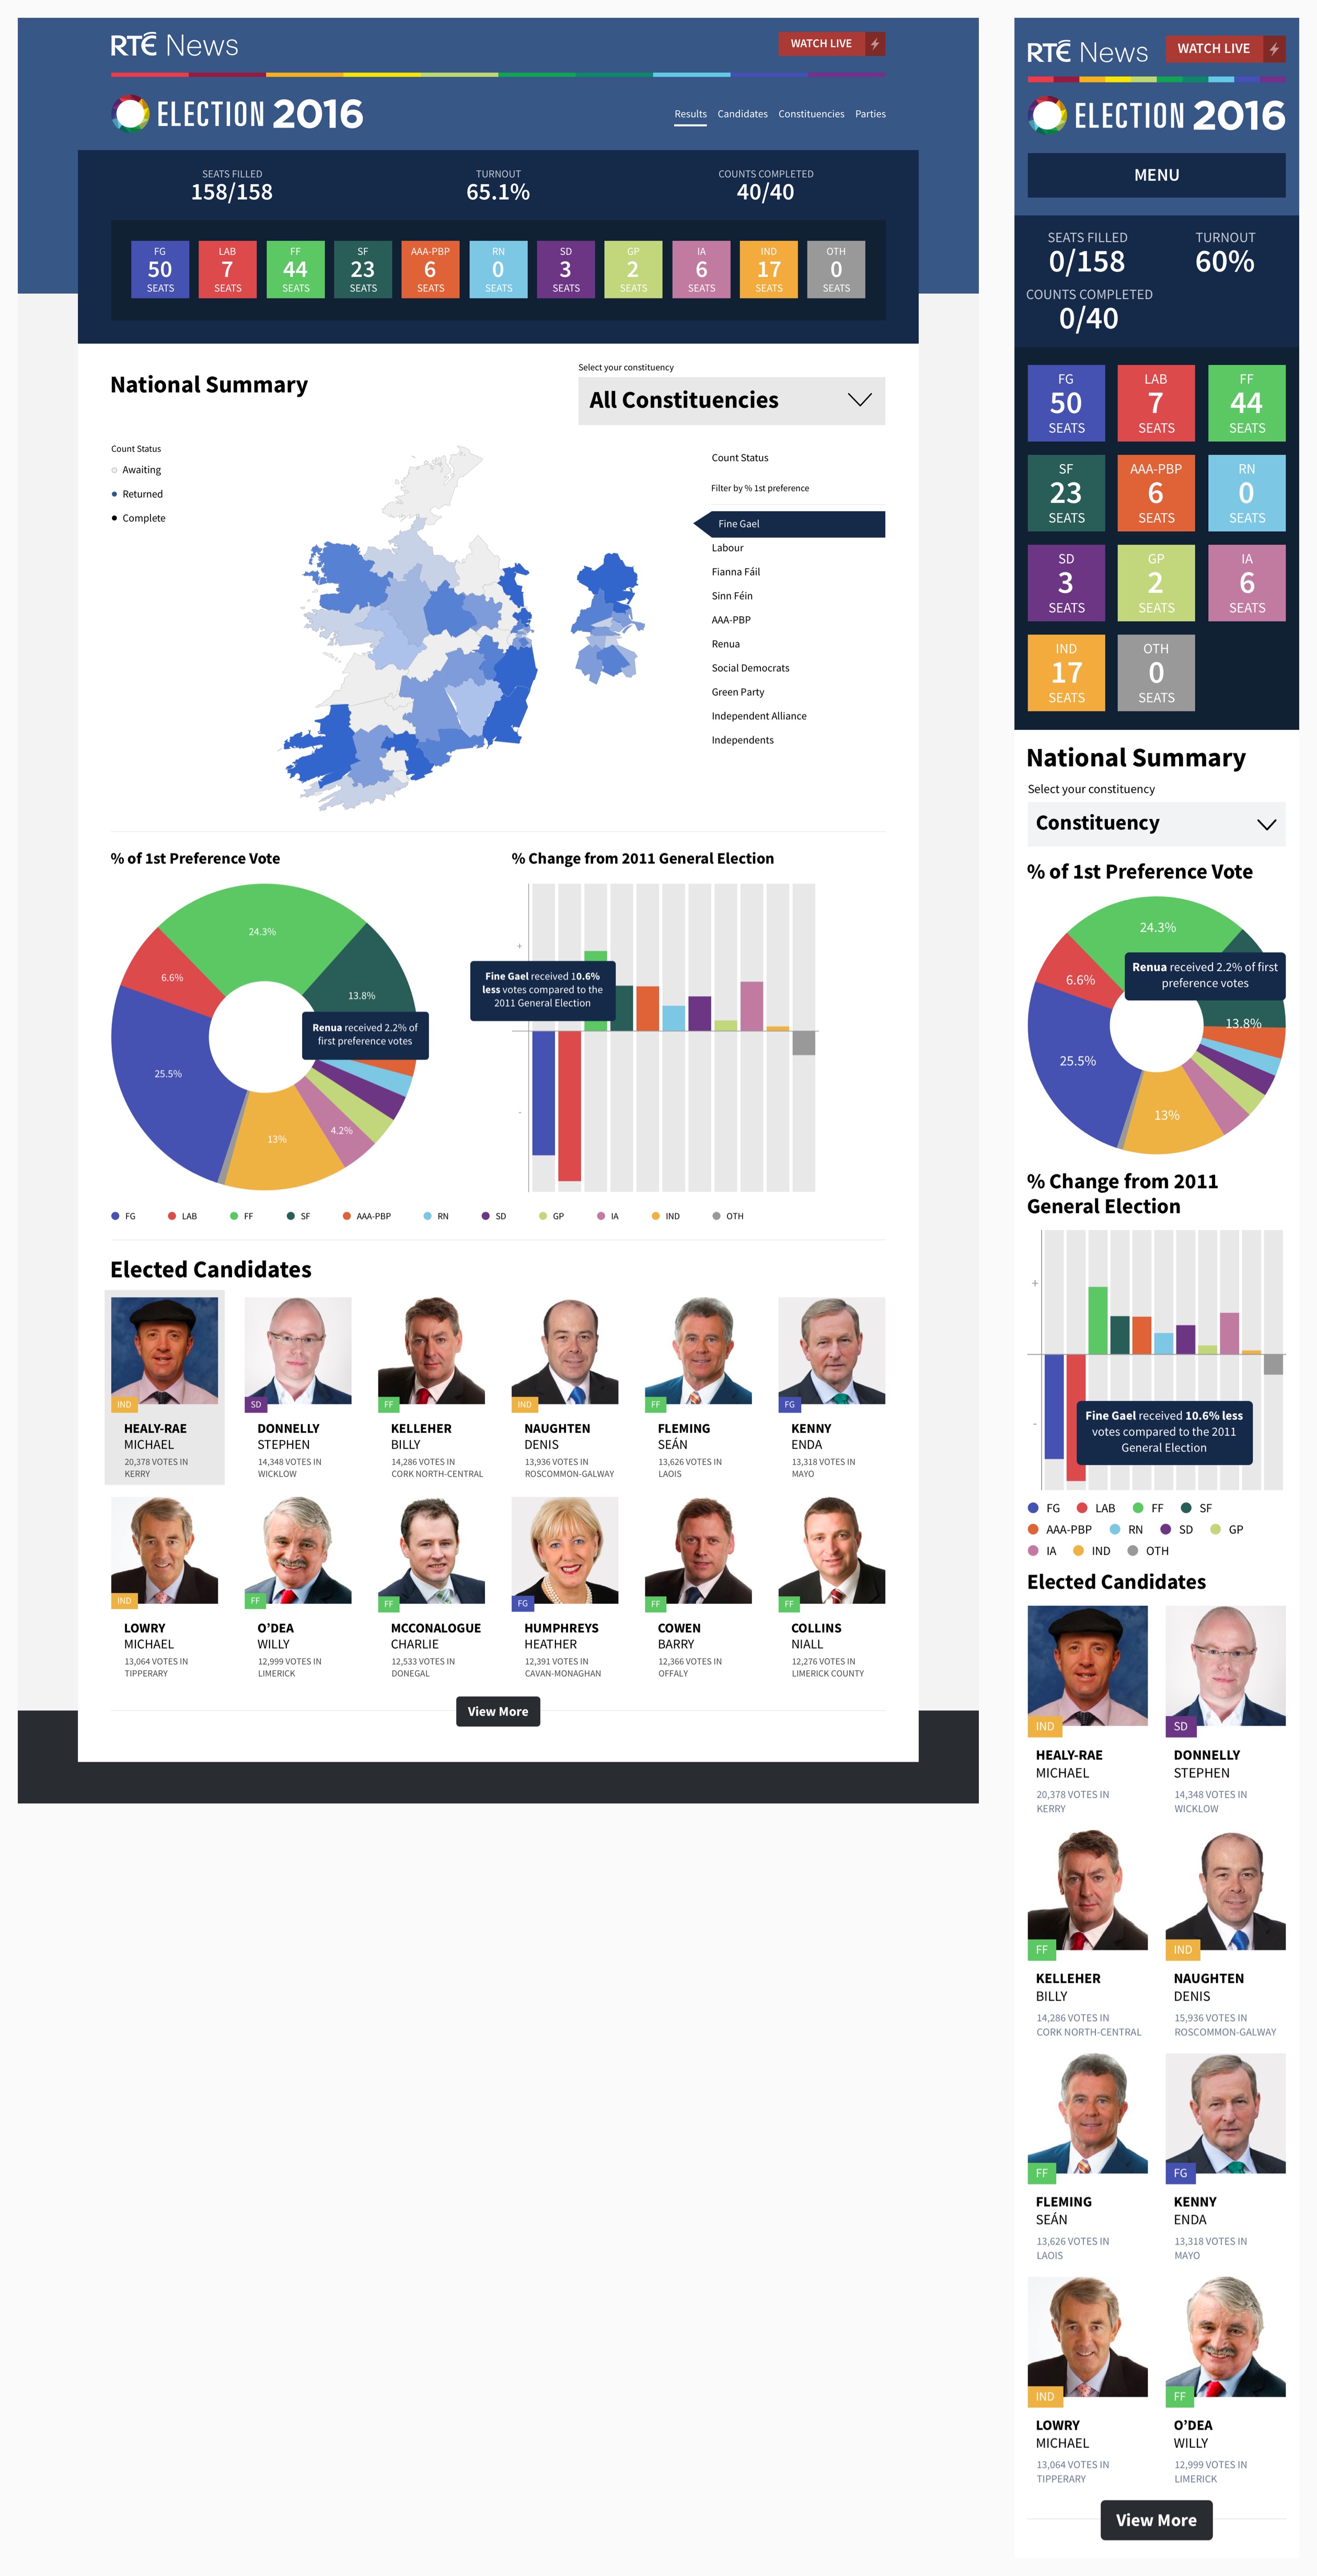
Desktop and mobile views of the national results for General Election 2016.
Development
Handover
For each election, I create Invision screens for the internal development team for all panels and page templates across three different breakpoints (mobile, tablet and desktop). I work with the developers and audit their beta version for any style or functional issues.
Testing
A lot of testing is done by the development team using dummy data to simulate a wide-range of possible election scenarios. This allows us to spot and fix any bugs or inconsistencies with how the data is being displayed ahead of time.
With millions of page views per day, a lot of effort goes into making sure all the data displayed is accurate and up to date. RTÉ News online editors, TV producers and election experts also give feedback on the tests to make sure the correct data is always displayed to the user. The party order, acronyms and colour palette and all terminology is matched to those used on TV, to ensure consistency across platforms.
Design Library
I have created a master symbol-based Sketch design library file containing all responsive panels and components, text styles and colours used in the election design system. This allows us to easily focus on improvements or updates to specific panels rather than entire pages, reducing the time needed to create prototypes for development for future elections. The library file can be synced to Dropbox to allow myself and other designers to easily access it, use elements from it and update it.
Hopefully this gives you an insight into my process designing RTÉ’s online election results. For a case study of other recent design system projects, please read Designing RTÉ.ie or Designing RTÉ Radio.